

Effects of N-linked glycosylation on the creatine transporter
- PMID: 16167890
- PMCID: PMC1360696
- DOI: 10.1042/BJ20050857
Effects of N-linked glycosylation on the creatine transporter
Abstract
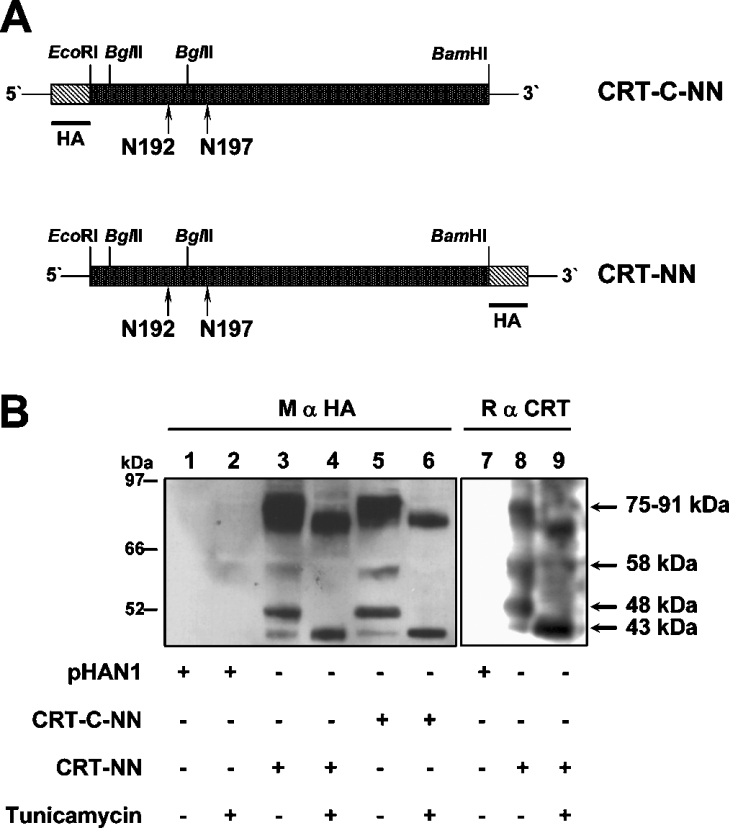
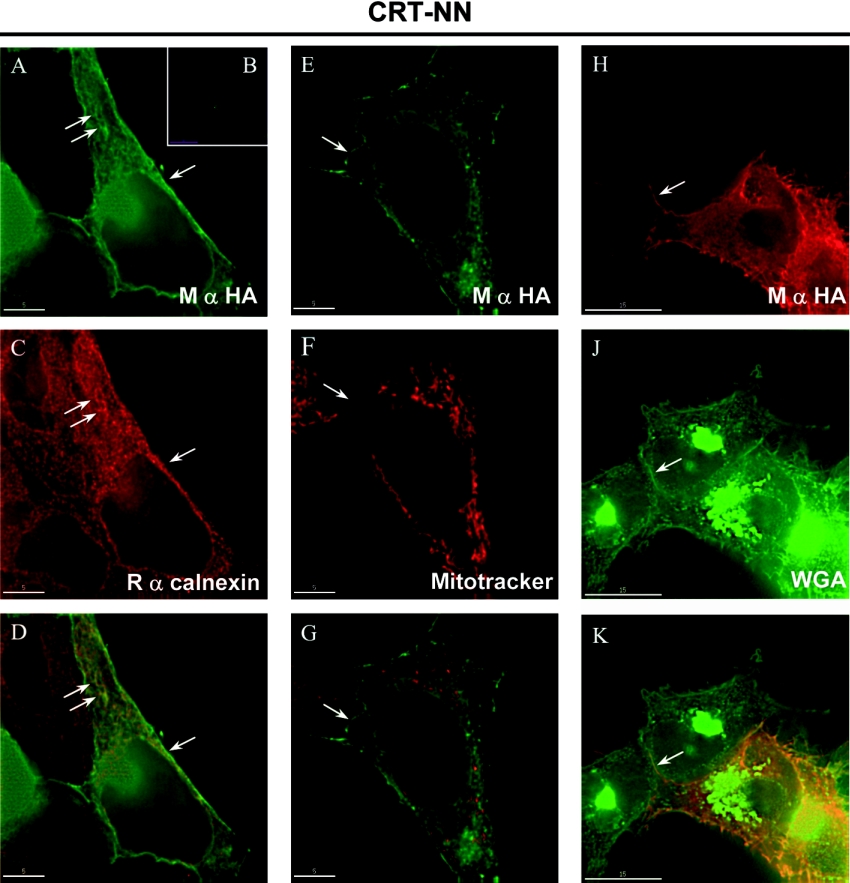
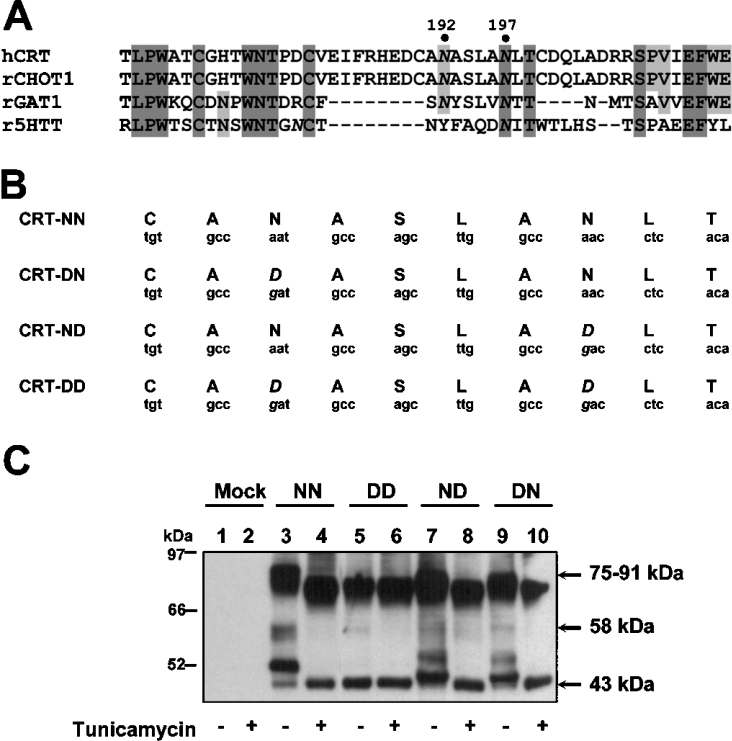
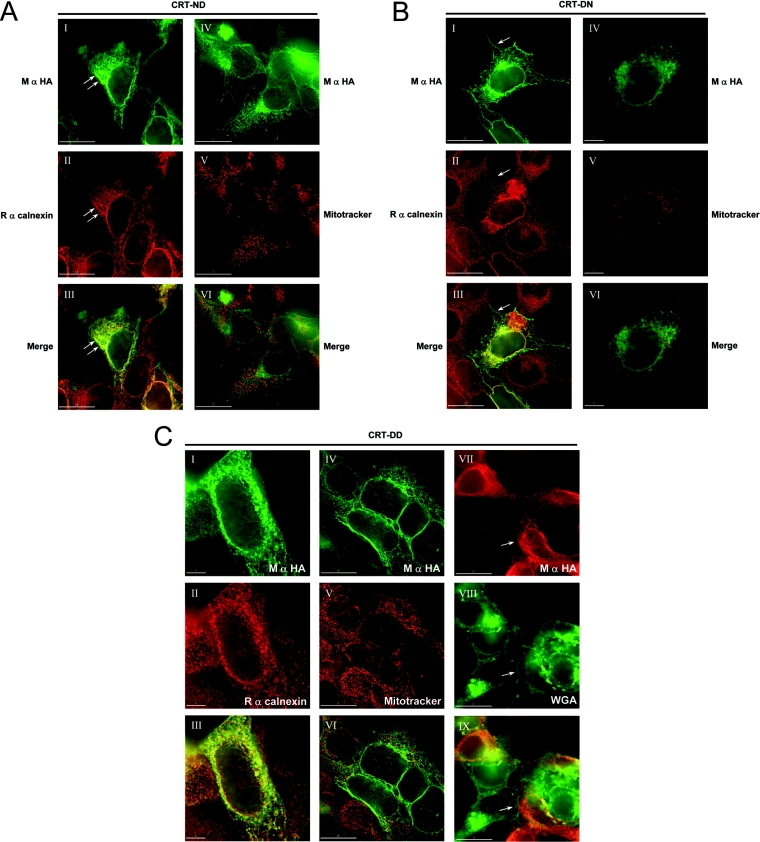
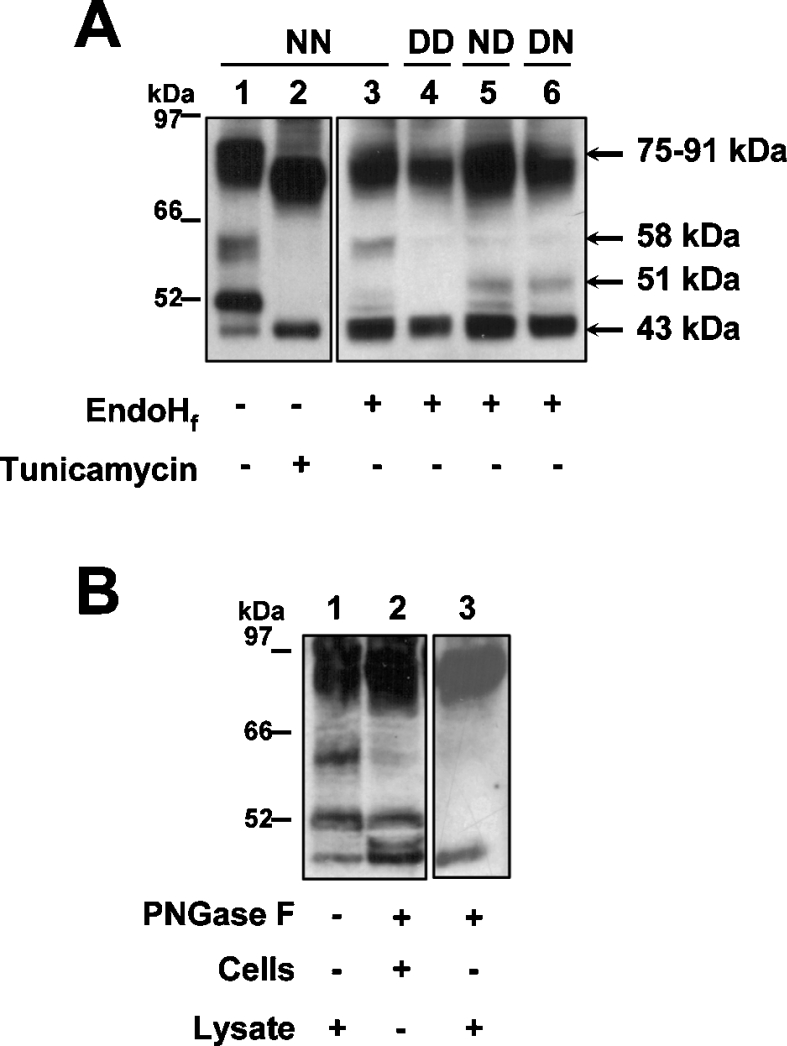
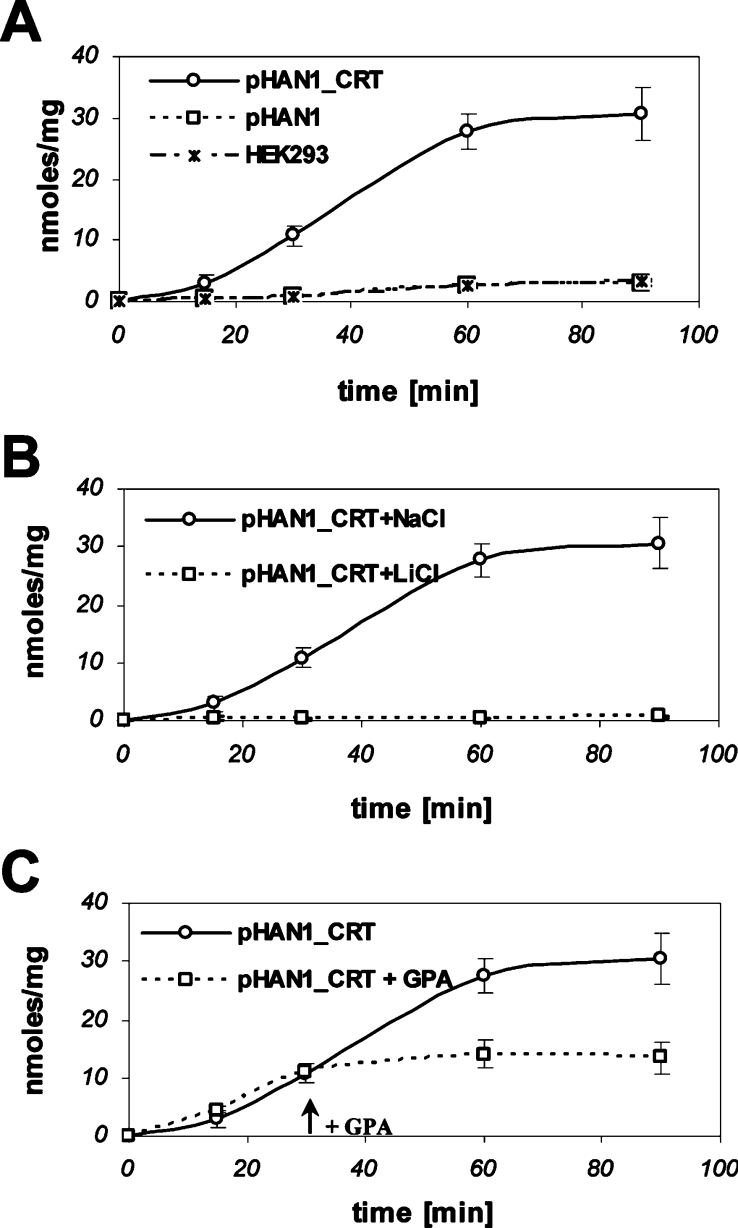
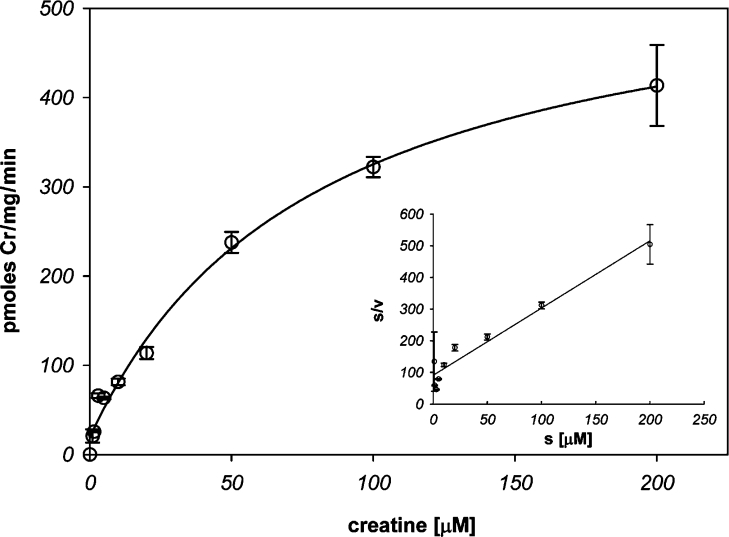
The CRT (creatine transporter) is a member of the Na+- and Cl--dependent neurotransmitter transporter family and is responsible for the import of creatine into cells, and thus is important for cellular energy metabolism. We established for CRT an expression system in HEK-293 cells that allowed biochemical, immunological and functional analysis of CRT wild-type and glycosylation-deficient mutants. Analysis of HA (haemagglutinin)-tagged CRT-NN (wild-type rat CRT with an HA-tag at the C-terminus) revealed several monomeric immunoreactive species with apparent molecular masses of 58, 48 and 43 kDa. The 58 kDa species was shown to be plasma-membrane-resident by EndoHf (endoglycosidase Hf) and PNGase F (peptide N-glycosidase F) treatments and represents fully glycosylated CRT, whereas the 48 kDa and 43 kDa species were glycosylation intermediates and non-glycosylated CRT respectively. Glycosylation-deficient mutants (Asn192Asp, Asn197Asp and Asn192Asp/Asn197Asp) showed altered electrophoretic mobility, indicating that CRT is indeed N-glycosylated. In addition, a prominent CRT band in the range of 75-91 kDa was also detected. Pharmacological inhibition of N-linked glycosylation by tunicamycin in CRT-NN-expressing cells gave a similar reduction in molecular mass, corroborating the finding that Asn192 and Asn197 are major N-glycosylation sites in CRT. Although the apparent Km was not significantly affected in glycosylation-deficient mutants compared with CRT-NN, we measured reduced Vmax values for all mutants (21-28% residual activity), and 51% residual activity after enzymatic deglycosylation of surface proteins in intact CRT-NN cells by PNGase F. Moreover, immunocytochemical analysis of CRT-NN- and CRT-DD-expressing cells (where CRT-DD represents a non-glycosylated double mutant of CRT, i.e. Asn192Asp/Asn197Asp) showed a lower abundance of CRT-DD in the plasma membrane. Taken together, our results suggest that plasma-membrane CRT is glycosylated and has an apparent monomer molecular mass of 58 kDa. Furthermore, N-linked glycosylation is neither exclusively important for the function of CRT nor for surface trafficking, but affects both processes. These findings may have relevance for closely related neurotransmitter transporter family members.
Figures
Similar articles
-
N-Glycosylation of the human kappa opioid receptor enhances its stability but slows its trafficking along the biosynthesis pathway.Biochemistry. 2007 Sep 25;46(38):10960-70. doi: 10.1021/bi700443j. Epub 2007 Aug 21. Biochemistry. 2007. PMID: 17711303
-
Abnormal N-Glycosylation of a Novel Missense Creatine Transporter Mutant, G561R, Associated with Cerebral Creatine Deficiency Syndromes Alters Transporter Activity and Localization.Biol Pharm Bull. 2017;40(1):49-55. doi: 10.1248/bpb.b16-00582. Biol Pharm Bull. 2017. PMID: 28049948
-
N-linked deglycosylated melanopsin retains its responsiveness to light.Biochemistry. 2009 Jun 16;48(23):5142-8. doi: 10.1021/bi900249n. Biochemistry. 2009. PMID: 19413349
-
Functional insights into the creatine transporter.Subcell Biochem. 2007;46:99-118. doi: 10.1007/978-1-4020-6486-9_6. Subcell Biochem. 2007. PMID: 18652074 Review.
-
Creatine and the creatine transporter: a review.Mol Cell Biochem. 2001 Aug;224(1-2):169-81. doi: 10.1023/a:1011908606819. Mol Cell Biochem. 2001. PMID: 11693194 Review.
Cited by
-
Role of N-linked glycosylation of the 5-HT2A receptor in JC virus infection.J Virol. 2010 Oct;84(19):9677-84. doi: 10.1128/JVI.00978-10. Epub 2010 Jul 21. J Virol. 2010. PMID: 20660194 Free PMC article.
-
Role of N-glycosylation in renal betaine transport.Biochem J. 2015 Sep 1;470(2):169-79. doi: 10.1042/BJ20131031. Epub 2015 Jun 11. Biochem J. 2015. PMID: 26348906 Free PMC article.
-
Developmental changes in the expression of creatine synthesizing enzymes and creatine transporter in a precocial rodent, the spiny mouse.BMC Dev Biol. 2009 Jul 1;9:39. doi: 10.1186/1471-213X-9-39. BMC Dev Biol. 2009. PMID: 19570237 Free PMC article.
-
Outcome of creatine supplementation therapy in phosphoglucomutase-1 deficiency associated congenital disorders of glycosylation: Novel insights.Mol Genet Metab Rep. 2025 Apr 3;43:101212. doi: 10.1016/j.ymgmr.2025.101212. eCollection 2025 Jun. Mol Genet Metab Rep. 2025. PMID: 40242152 Free PMC article.
-
The creatine kinase system and pleiotropic effects of creatine.Amino Acids. 2011 May;40(5):1271-96. doi: 10.1007/s00726-011-0877-3. Epub 2011 Mar 30. Amino Acids. 2011. PMID: 21448658 Free PMC article. Review.
References
-
- Wallimann T., Dolder M., Schlattner U., Eder M., Hornemann T., Kraft T., Stolz M. Creatine kinase: an enzyme with a central role in cellular energy metabolism. Magma. 1998;6:116–119. - PubMed
-
- Palacin M., Estevez R., Bertran J., Zorzano A. Molecular biology of mammalian plasma membrane amino acid transporters. Physiol. Rev. 1998;78:969–1054. - PubMed
-
- Malandro M. S., Kilberg M. S. Molecular biology of mammalian amino acid transporters. Annu. Rev. Biochem. 1996;65:305–336. - PubMed
-
- Salomons G. S., van Dooren S. J., Verhoeven N. M., Marsden D., Schwartz C., Cecil K. M., DeGrauw T. J., Jakobs C. X-linked creatine transporter defect: an overview. J. Inherit. Metab. Dis. 2003;26:309–318. - PubMed
-
- van der Knaap M. S., Verhoeven N. M., Maaswinkel-Mooij P., Pouwels P. J., Onkenhout W., Peeters E. A., Stockler-Ipsiroglu S., Jakobs C. Mental retardation and behavioral problems as presenting signs of a creatine synthesis defect. Ann. Neurol. 2000;47:540–543. - PubMed
Publication types
MeSH terms
Substances
LinkOut - more resources
Full Text Sources
Research Materials
Miscellaneous