

doi: 10.1186/gb-2005-6-9-r81.
Epub 2005 Aug 31.
L2L: a simple tool for discovering the hidden significance in microarray expression data
Affiliations
- PMID: 16168088
- PMCID: PMC1242216
- DOI: 10.1186/gb-2005-6-9-r81
Item in Clipboard
L2L: a simple tool for discovering the hidden significance in microarray expression data
Genome Biol.
2005.
Abstract
L2L is a database consisting of lists of differentially expressed genes compiled from published mammalian microarray studies, along with an easy-to-use application for mining the database with the user's own microarray data. As illustrated by re-analysis of a recent study of diabetic nephropathy, L2L identifies novel biological patterns in microarray data, providing insights into the underlying nature of biological processes and disease. L2L is available online at the authors' website [http://depts.washington.edu/l2l/].
Figures
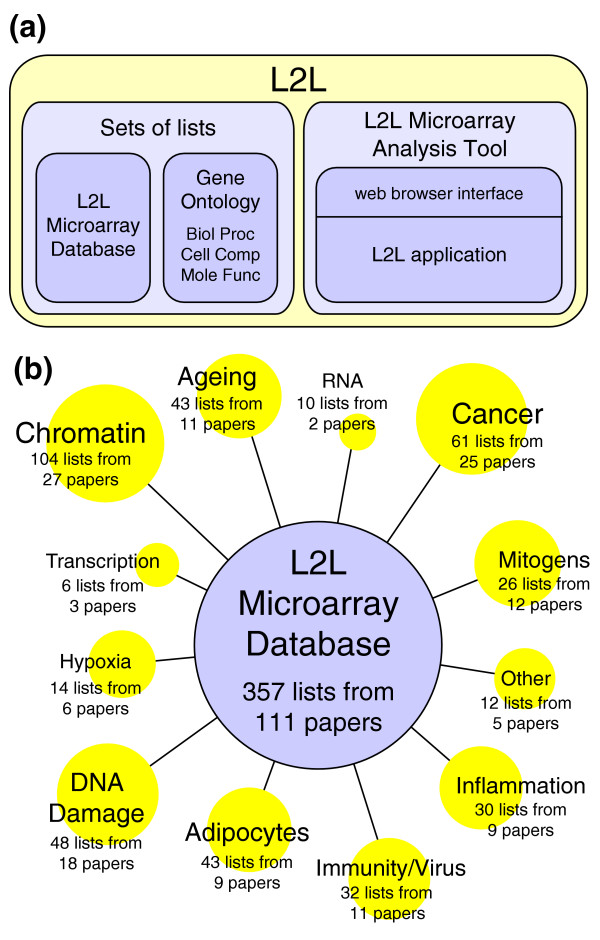
L2L and the L2L microarray database. (a) The centerpiece of L2L is the L2L Microarray Database, a collection of published microarray data in the form of lists of genes that are up- or downregulated in some condition. The L2L Microarray Analysis Tool (MAT) is a program that compares those lists with a user's microarray data, and reports statistically significant overlaps. The analysis tool includes a web browser interface, but the L2L application itself can be downloaded and run directly from the command line for batch or customized analyses. Three additional sets of lists, based on the three organizing principles of Gene Ontology, can also be used with the analysis tool. (b) The L2L Microarray Database contains over 350 lists compiled from over 100 selected microarray publications. A wide variety of topics are represented, from chromatin modifications and DNA damage to the immune response and adipocyte differentiation.
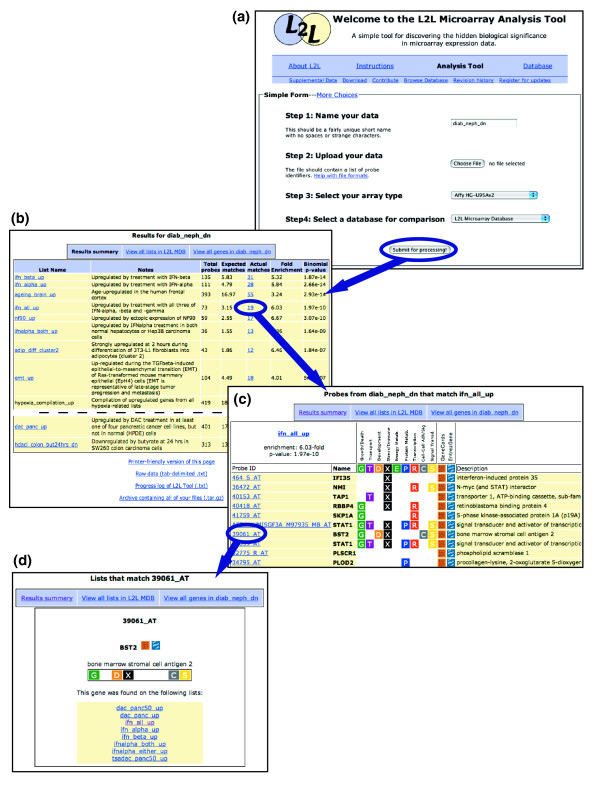
L2L uses a simple web-based interface, and generates easy-to-navigate, annotated HTML pages as output. (a) The L2L web interface. (b) The Results summary page displays each list from the database that significantly matched the data, along with links to list annotations and Listmatch pages. (c) An example Listmatch page, which displays all of the probes on a list that match the data, with a variety of annotations and links to Probematch pages. (d) Probematch pages show all of the lists on which a probe is found, with links back to their Listmatch pages. Arrows indicate sample navigation paths between the output pages.
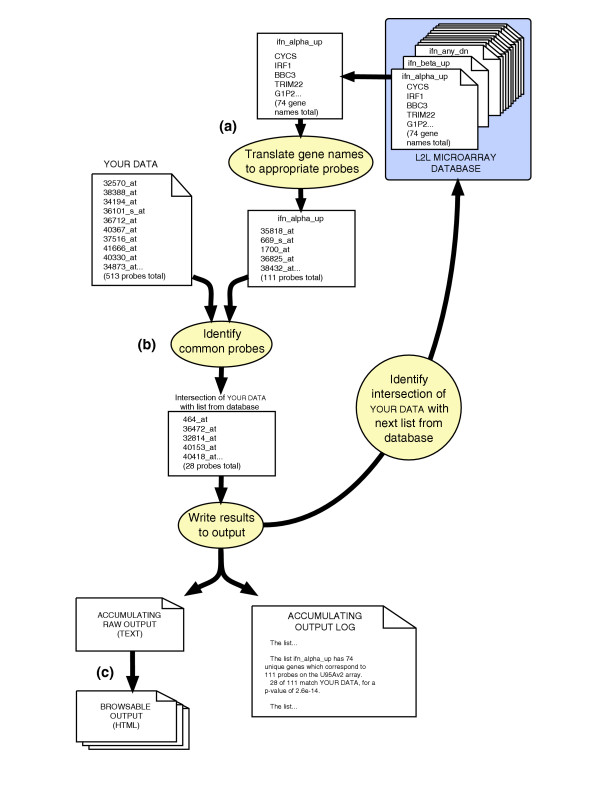
The L2L application sequentially compares each list in the database with the input data, and records the overlap between the two lists of genes. (a) Each list in the database is a list of HUGO symbols. These are first translated to the corresponding microarray probes that represent those genes. Depending on the microarray, some genes on a list are represented by multiple probes and some by none at all. (b) The program finds the intersection between the translated list of probes from the database and the user's list of probes. The results are logged and written to a raw output file. The program then proceeds to the next list in the database. (c) Once all lists in the database have been compared with the user's data, the program creates a set of HTML pages to browse the output.
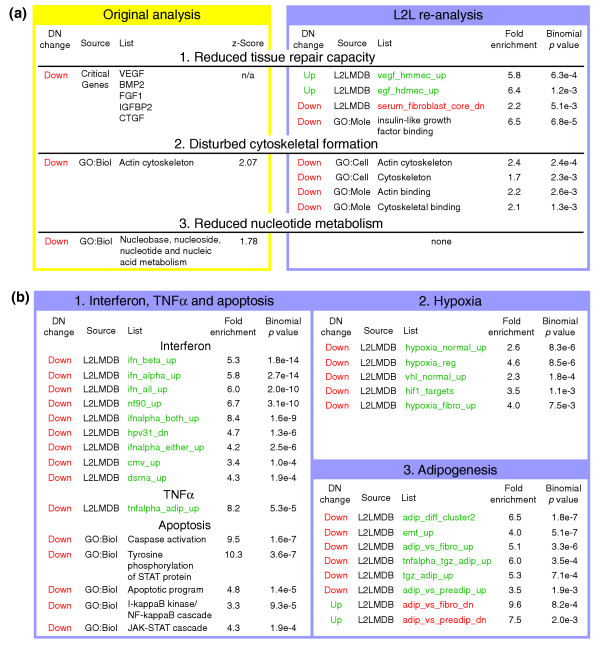
L2L analysis of gene expression changes in diabetic nephropathy (DN). (a) Three major conclusions of Baelde et al. [36] revisited. L2L finds support for cytoskeletal dysfunction, but no evidence of reduced nucleotide metabolism. Evidence for the central thesis, reduced tissue repair capacity, is mixed. L2L found reduced expression of IGF-binding proteins, suggesting a defect in response to these growth factors. However, L2L also found a correlation between genes repressed by the serum-response and genes downregulated in DN, as well as a correlation between genes upregulated in DN and genes induced by EGF and VEGF - despite reduced expression of VEGF itself in DN kidneys. (b) Three new biological themes in DN found by L2L. 1. Interferon, TNFα, and their associated apoptotic pathways are all downregulated in DN. 2. The hypoxia response is impaired in DN. 3. Pathways associated with adipogenesis and adipocyte function are downregulated in DN. Complete results, along with descriptions and annotations for all lists, can be found on the L2L website [6]. Red or green denote reduced or increased expression, respectively, in DN or in the condition represented by a list.
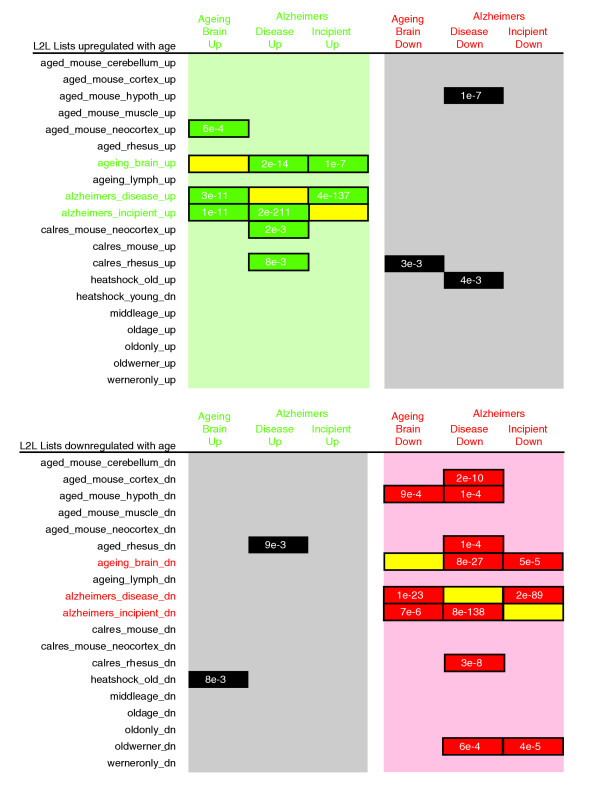
L2L analysis of gene expression changes in two studies of the ageing human brain. Lists of differentially expressed genes from Lu et al. (ageing_brain) [61] and Blalock et al. (alzheimers_disease and alzheimers_incipient) [62] were compared with all ageing-related lists in the L2L Microarray Database, including each other (all data are available on the L2L website [6]). Numbers represent binomial p values for significance of overlap. Green denotes overlap between lists of genes upregulated with ageing; red denotes overlap between lists of genes downregulated with ageing; black denotes overlap between lists of contrary directions; yellow denotes self-self comparisons.
Similar articles
-
Gene Aging Nexus: a web database and data mining platform for microarray data on aging.Nucleic Acids Res. 2007 Jan;35(Database issue):D756-9. doi: 10.1093/nar/gkl798. Epub 2006 Nov 7. Nucleic Acids Res. 2007. PMID: 17090592 Free PMC article.
-
MILANO--custom annotation of microarray results using automatic literature searches.BMC Bioinformatics. 2005 Jan 20;6:12. doi: 10.1186/1471-2105-6-12. BMC Bioinformatics. 2005. PMID: 15661078 Free PMC article.
-
Meta-analysis of microarray results: challenges, opportunities, and recommendations for standardization.Gene. 2007 Oct 15;401(1-2):12-8. doi: 10.1016/j.gene.2007.06.016. Epub 2007 Jul 3. Gene. 2007. PMID: 17651921 Free PMC article. Review.
-
GFINDer: Genome Function INtegrated Discoverer through dynamic annotation, statistical analysis, and mining.Nucleic Acids Res. 2004 Jul 1;32(Web Server issue):W293-300. doi: 10.1093/nar/gkh432. Nucleic Acids Res. 2004. PMID: 15215397 Free PMC article.
-
Harnessing the power of gene microarrays for the study of brain aging and Alzheimer's disease: statistical reliability and functional correlation.Ageing Res Rev. 2005 Nov;4(4):481-512. doi: 10.1016/j.arr.2005.06.006. Epub 2005 Oct 27. Ageing Res Rev. 2005. PMID: 16257272 Review.
Cited by
-
Characterization of the early CNS stress biomarkers and profiles associated with neuropsychiatric diseases.Curr Genomics. 2012 Sep;13(6):489-97. doi: 10.2174/138920212802510448. Curr Genomics. 2012. PMID: 23449133 Free PMC article.
-
Selection upon genome architecture: conservation of functional neighborhoods with changing genes.PLoS Comput Biol. 2010 Oct 7;6(10):e1000953. doi: 10.1371/journal.pcbi.1000953. PLoS Comput Biol. 2010. PMID: 20949098 Free PMC article.
-
Transcriptome meta-analysis reveals differences of immune profile between eutopic endometrium from stage I-II and III-IV endometriosis independently of hormonal milieu.Sci Rep. 2020 Jan 15;10(1):313. doi: 10.1038/s41598-019-57207-y. Sci Rep. 2020. PMID: 31941945 Free PMC article.
-
Meta-analysis of muscle transcriptome data using the MADMuscle database reveals biologically relevant gene patterns.BMC Genomics. 2011 Feb 16;12:113. doi: 10.1186/1471-2164-12-113. BMC Genomics. 2011. PMID: 21324190 Free PMC article.
-
An abundant evolutionarily conserved CSB-PiggyBac fusion protein expressed in Cockayne syndrome.PLoS Genet. 2008 Mar 21;4(3):e1000031. doi: 10.1371/journal.pgen.1000031. PLoS Genet. 2008. PMID: 18369450 Free PMC article.
References
-
- Boyle EI, Weng S, Gollub J, Jin H, Botstein D, Cherry JM, Sherlock G. GO::TermFinder - open source software for accessing Gene Ontology information and finding significantly enriched Gene Ontology terms associated with a list of genes. Bioinformatics. 2004;20:3710–3715. doi: 10.1093/bioinformatics/bth123. - DOI - PMC - PubMed
Publication types
MeSH terms
Grants and funding
LinkOut - more resources
Full Text Sources
Other Literature Sources
Molecular Biology Databases
Research Materials
