. 2005 Sep 27;102(39):13795-800.
doi: 10.1073/pnas.0506447102. Epub 2005 Sep 16.

Open clamp structure in the clamp-loading complex visualized by electron microscopic image analysis

Affiliations

Open clamp structure in the clamp-loading complex visualized by electron microscopic image analysis

Tomoko Miyata et al. Proc Natl Acad Sci U S A. .

Abstract

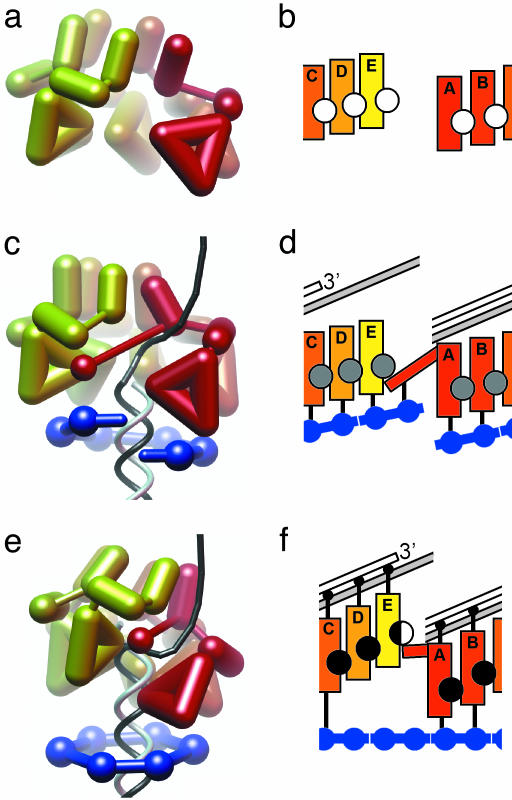
Ring-shaped sliding clamps and clamp loader ATPases are essential factors for rapid and accurate DNA replication. The clamp ring is opened and resealed at the primer-template junctions by the ATP-fueled clamp loader function. The processivity of the DNA polymerase is conferred by its attachment to the clamp loaded onto the DNA. In eukarya and archaea, the replication factor C (RFC) and the proliferating cell nuclear antigen (PCNA) play crucial roles as the clamp loader and the clamp, respectively. Here, we report the electron microscopic structure of an archaeal RFC-PCNA-DNA complex at 12-A resolution. This complex exhibits excellent fitting of each atomic structure of RFC, PCNA, and the primed DNA. The PCNA ring retains an open conformation by extensive interactions with RFC, with a distorted spring washer-like conformation. The complex appears to represent the intermediate, where the PCNA ring is kept open before ATP hydrolysis by RFC.


Figures

Fig. 1.
Fig. 1.
Single-particle reconstruction of the clamp-loading complex. (a) The top row shows examples of the individual particle images in various orientations, with the respective 2D class averages in the middle row. The bottom row represents the reprojections of the 3D structure of the clamp-loading complex. Good correlation of the class-averages and respective reprojection indicates the reliability of the 3D map. (Scale bar, 100 Å.) (b) Schematic representation of the priDNAs. The nonlabeled clamp-loading complex with the best quality was reconstructed by using pri11/30 (cyan). The ds-labeled complex was generated by using pri25/40 biotinylated at the 5′ end of the primer strand (yellow), and the ss-labeled one was generated by using pri25/40 with 5′ biotin of the template strand (magenta). (c) Surface representations of the ternary complex. Back, front, bottom, and top views are shown from left to right. (d) Structures of the ds-labeled (first, yellow) and ss-labeled (second, magenta) complexes are superimposed onto the nonlabeled complex (third and fourth, cyan). The third and fourth images correspond to the front and bottom views in c, respectively. The label positions are indicated by the arrows with respective colors. (Scale bar, 100 Å.)
Fig. 2.
Fig. 2.
Fitting of atomic models into the EM 3D map of the clamp-loading complex. (a) Front (Upper) and back (Lower) views corresponding to Fig. 1c are shown as stereo pairs. RFCSs are colored gold, green, cyan, violet, and sky blue. The gold RFCS corresponds to RFCL. Three PCNA subunits are depicted in purple, yellow-green, and red. An 11-nt DNA duplex is fitted into the rod-like density encircled by PCNA. (b) A difference density map (see text) is shown from the front (Left) and back (Right) sides, with the meshed surface of the complex. (c) Cut-away views of the complex with the fitted atomic models. Views 1 and 2 show the central region of the complex from the back and front. Views 3–5 are cut-away perpendicular to views 1 and 2, showing the C-terminal collar of RFC in the top (view 3) of the complex, the AAA+ domains of RFC in the middle (view 4), and the open clamp structure in the bottom (view 5).
Fig. 3.
Fig. 3.
Structural comparison of the Pfu clamp-loading complex with the E. coli clamp loader γ complex and the yeast clamp loader–clamp binary complex. (a) The Pfu clamp-loading complex is shown by a mesh surface, and the crystal structure of the E. coli γ clamp loader (PDB ID code 1JR3) is depicted by a ribbon diagram. The component subunits, δ, γ3, γ2, γ1, and δ′, are colored yellow, green, blue, cyan, and red, respectively. Cut-away views highlighting the collar region (view 1) and the AAA+ domains (view 2) are shown from the bottom. (Scale bar, 100 Å.) (b) Stereo view of a difference density map (magenta, see text), shown from the front with the fitted atomic models of the Pfu clamp-loading complex. The yellow RFCS is located within the RFCL site. An RFCS, which contacts the putative C-terminal domain of RFCL, is colored cyan. (c) The crystal structure of the yeast clamp loader–clamp complex (PDB ID code 1SXJ), shown as stereo pairs. Domains I to III of the RFC1 subunit, which corresponds to PfuRFCL, are depicted by a yellow ribbon, and domain IV is shown by a magenta space-filling model. RFC5 is colored cyan. (d) Schematic drawing of the domain organization of the RFC subunits. The domains of PfuRFCL were predicted based on their possible structural similarity to yeast RFC1.
Fig. 4.
Fig. 4.
Structural comparison of clamp loaders and sliding clamps. (a, c, and e) The schematic 3D models of the E. coli γ clamp loader (open) alone (a), the archaeal RFC(open)–PCNA(open)–DNA ternary complex (c), and a ternary complex model based on the yeast RFC(closed)–PCNA(closed) binary complex (e). (b, d, and f) Schematic representations showing the interaction modes among clamp loaders, sliding clamps, and DNA, corresponding to the structures (a, c, and e), respectively. These structures, derived from different protein sources and techniques, appear to represent static snapshots during a common clamp-loading mechanism conserved across the domains of life. Circles in the clamp loader complexes represent nucleotide binding states in the three structures. White circles in b show the nucleotide-empty state. Gray circles in d show ATP binding or empty states, as suggested from a biochemical analysis. Black circles and the half filled circle in f represent the ATPγS and either ADP or ATPγS binding states, respectively, observed in the crystal structure.

Comment in

  • The opened processivity clamp slides into view.
    Jeruzalmi D. Jeruzalmi D. Proc Natl Acad Sci U S A. 2005 Oct 18;102(42):14939-40. doi: 10.1073/pnas.0507120102. Epub 2005 Oct 10. Proc Natl Acad Sci U S A. 2005. PMID: 16217036 Free PMC article. No abstract available.

References

    1. Waga, S. & Stillman, B. (1998) Annu. Rev. Biochem. 67, 721–751. - PubMed
    1. Tsurimoto, T. & Stillman, B. (1991) J. Biol. Chem. 266, 1950–1960. - PubMed
    1. Cai, J., Yao, N., Gibbs, E., Finkelstein, J., Phillips, B., O'Donnell, M. & Hurwitz, J. (1998) Proc. Natl. Acad. Sci. USA 95, 11607–11612. - PMC - PubMed
    1. Turner, J., Hingorani, M. M., Kelman, Z. & O'Donnell, M. (1999) EMBO J. 18, 771–783. - PMC - PubMed
    1. Cann, I. K., Ishino, S., Yuasa, M., Daiyasu, H., Toh, H. & Ishino, Y. (2001) J. Bacteriol. 183, 2614–2623. - PMC - PubMed

Publication types

MeSH terms