

Cauliflower mosaic virus, a compatible pathogen of Arabidopsis, engages three distinct defense-signaling pathways and activates rapid systemic generation of reactive oxygen species
- PMID: 16169957
- PMCID: PMC1256007
- DOI: 10.1104/pp.105.066803
Cauliflower mosaic virus, a compatible pathogen of Arabidopsis, engages three distinct defense-signaling pathways and activates rapid systemic generation of reactive oxygen species
Abstract
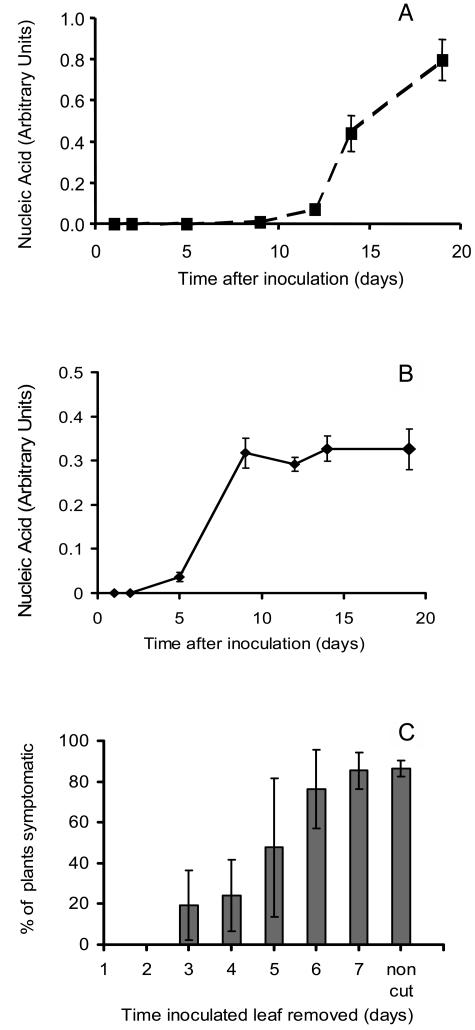
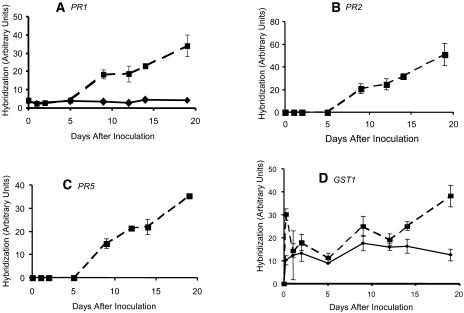
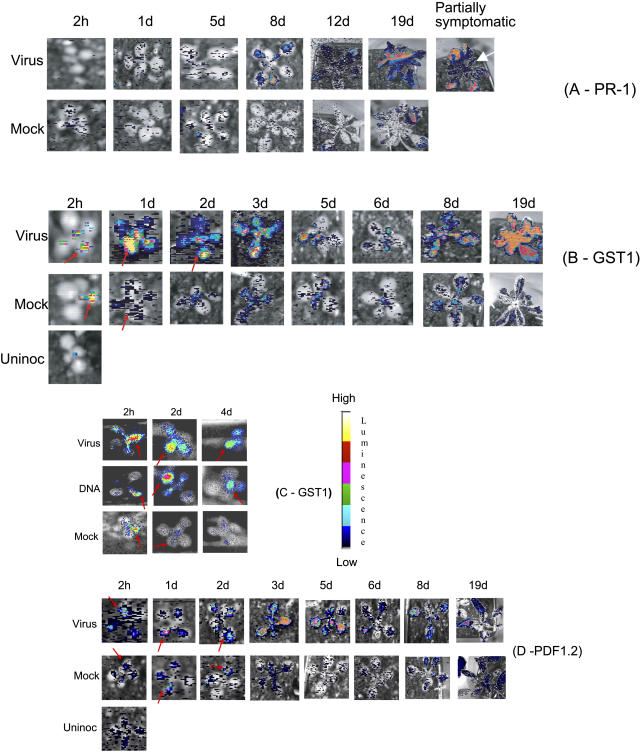
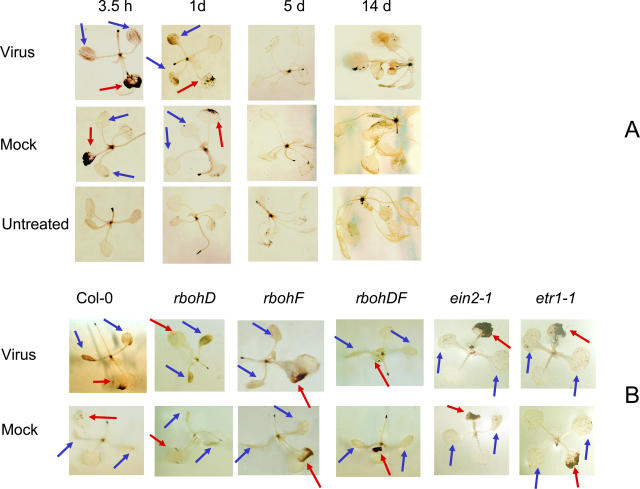
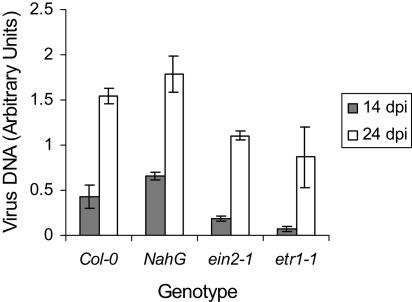
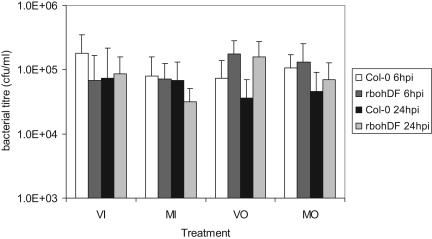
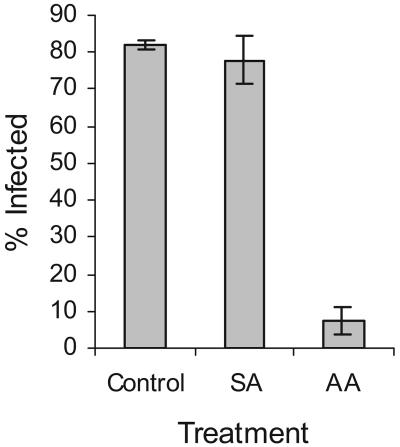
We analyzed expression of marker genes for three defense pathways during infection by Cauliflower mosaic virus (CaMV), a compatible pathogen of Arabidopsis (Arabidopsis thaliana), using luciferase reporter transgenes and directly by measuring transcript abundance. Expression of PR-1, a marker for salicylic acid signaling, was very low until 8 d postinoculation and then rose sharply, coinciding with the rise in virus levels. In contrast, as early as 2 h postinoculation, transcriptional up-regulation of GST1-a marker for reactive oxygen species-and PDF1.2-a marker for jasmonic acid/ethylene defense signaling-was detectable in the virus-inoculated leaf and systemically. In parallel with the activation of GST1, H(2)O(2) accumulated locally and systemically in virus- but not mock-inoculated plants. However, in plants inoculated with infectious CaMV DNA rather than virus particles, the onset of systemic luciferase activity was delayed by 24 to 48 h, suggesting that virion structural proteins act as the elicitor. This phenomenon, which we term the rapid systemic response, preceded virus movement from the inoculated leaf; therefore, the systemic signal is not viral. Systemic, but not local, H(2)O(2) accumulation was abolished in rbohDF double mutants and in etr1-1 and ein2-1 mutants, implicating NADPH oxidase and ethylene signaling in the generation and transduction of the response. Ethylene, but not rbohDF mutants, also showed reduced susceptibility to CaMV, whereas in NahG transgenics, virus levels were similar to wild type. These findings implicate reactive oxygen species and ethylene in signaling in response to CaMV infection, but suggest that salicylic acid does not play an effective role.
Figures

Similar articles
-
Components of Arabidopsis defense- and ethylene-signaling pathways regulate susceptibility to Cauliflower mosaic virus by restricting long-distance movement.Mol Plant Microbe Interact. 2007 Jun;20(6):659-70. doi: 10.1094/MPMI-20-6-0659. Mol Plant Microbe Interact. 2007. PMID: 17555274
-
Arabidopsis mutants that suppress the phenotype induced by transgene-mediated expression of cauliflower mosaic virus (CaMV) gene VI are less susceptible to CaMV-infection and show reduced ethylene sensitivity.Plant Mol Biol. 2004 Sep;56(1):111-24. doi: 10.1007/s11103-004-2649-x. Plant Mol Biol. 2004. PMID: 15604731
-
Characterization of cauliflower mosaic virus (CaMV) resistance in virus-resistant ecotypes of Arabidopsis.Mol Plant Microbe Interact. 1996 Dec;9(9):810-8. doi: 10.1094/mpmi-9-0810. Mol Plant Microbe Interact. 1996. PMID: 8969529
-
Altered patterns of gene expression in Arabidopsis elicited by cauliflower mosaic virus (CaMV) infection and by a CaMV gene VI transgene.Mol Plant Microbe Interact. 1999 May;12(5):377-84. doi: 10.1094/MPMI.1999.12.5.377. Mol Plant Microbe Interact. 1999. PMID: 10226370
-
Salicylic acid-dependent expression of host genes in compatible Arabidopsis-virus interactions.Plant Physiol. 2005 Mar;137(3):1147-59. doi: 10.1104/pp.104.056028. Epub 2005 Feb 22. Plant Physiol. 2005. PMID: 15728340 Free PMC article.
Cited by
-
WRKY8 transcription factor functions in the TMV-cg defense response by mediating both abscisic acid and ethylene signaling in Arabidopsis.Proc Natl Acad Sci U S A. 2013 May 21;110(21):E1963-71. doi: 10.1073/pnas.1221347110. Epub 2013 May 6. Proc Natl Acad Sci U S A. 2013. PMID: 23650359 Free PMC article.
-
Activation of senescence-associated Dark-inducible (DIN) genes during infection contributes to enhanced susceptibility to plant viruses.Mol Plant Pathol. 2016 Jan;17(1):3-15. doi: 10.1111/mpp.12257. Epub 2015 May 4. Mol Plant Pathol. 2016. PMID: 25787925 Free PMC article.
-
Involvement of polyamine oxidase in wound healing.Plant Physiol. 2008 Jan;146(1):162-77. doi: 10.1104/pp.107.108902. Epub 2007 Nov 9. Plant Physiol. 2008. PMID: 17993545 Free PMC article.
-
Molecular dialogues between viruses and receptor-like kinases in plants.Mol Plant Pathol. 2019 Sep;20(9):1191-1195. doi: 10.1111/mpp.12812. Epub 2019 May 16. Mol Plant Pathol. 2019. PMID: 31094075 Free PMC article. Review.
-
UV-C-irradiated Arabidopsis and tobacco emit volatiles that trigger genomic instability in neighboring plants.Plant Cell. 2011 Oct;23(10):3842-52. doi: 10.1105/tpc.111.089003. Epub 2011 Oct 25. Plant Cell. 2011. PMID: 22028460 Free PMC article.
References
-
- Al Kaff NS, Covey SN (1994) Variation in biological properties of cauliflower mosaic-virus clones. J Gen Virol 75: 3137–3145 - PubMed
-
- Al Kaff NS, Covey SN (1995) Biological diversity of cauliflower mosaic-virus isolates expressed in 2 Brassica species. Plant Pathol 44: 516–526
-
- Baulcombe D (2002) Viral suppression of systemic silencing. Trends Microbiol 10: 306–308 - PubMed
-
- Bonas U, Lahaye T (2002) Plant disease resistance triggered by pathogen-derived molecules: refined models of specific recognition. Curr Opin Microbiol 5: 44–50 - PubMed
Publication types
MeSH terms
Substances
LinkOut - more resources
Full Text Sources
Molecular Biology Databases
Research Materials
