Comparative Study
. 2005 Dec;89(6):4374-81.
doi: 10.1529/biophysj.105.067769. Epub 2005 Sep 16.

The solution to the streptavidin-biotin paradox: the influence of history on the strength of single molecular bonds

Affiliations
Comparative Study

The solution to the streptavidin-biotin paradox: the influence of history on the strength of single molecular bonds

Frédéric Pincet et al. Biophys J. 2005 Dec.

Abstract

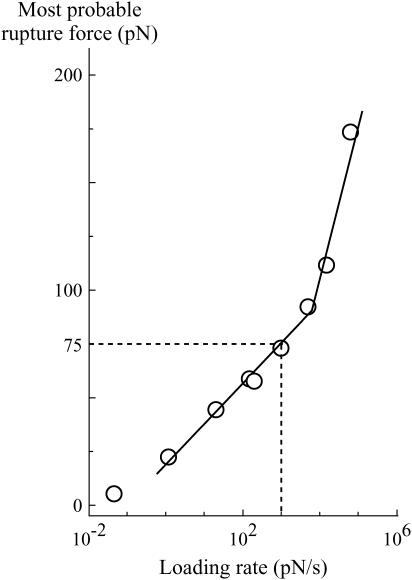
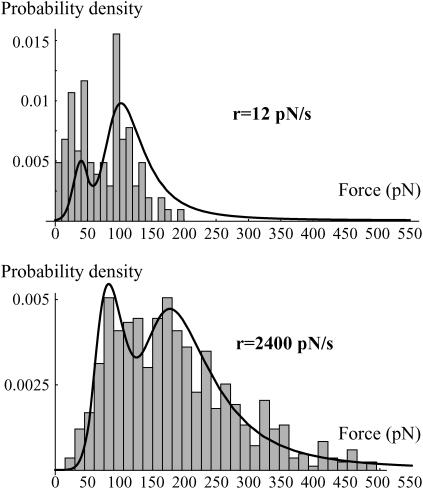
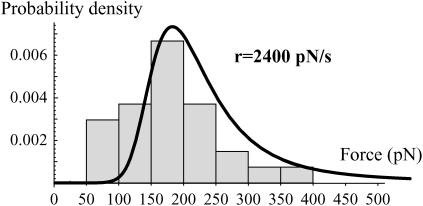
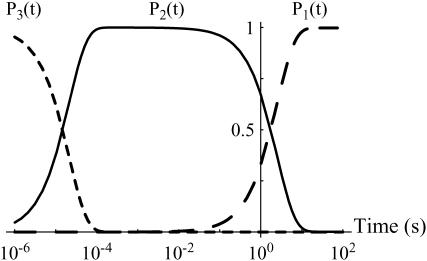
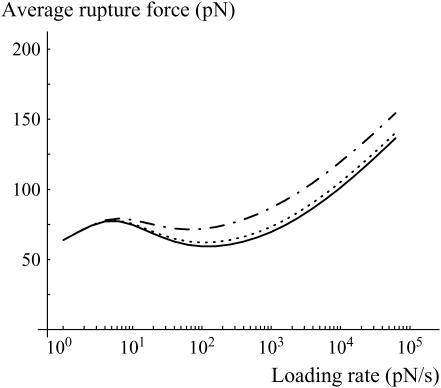
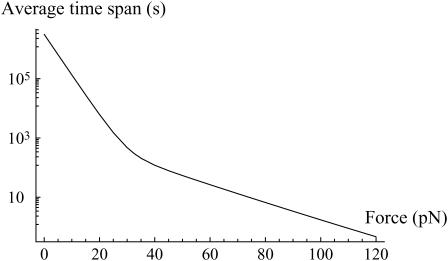
In the past few years, many studies have attempted to measure the strength of a single molecular bond. In general, these experiments consisted in pulling on the bond and measuring the force necessary to dissociate the molecules. However, seemingly contradictory experimental results led to draw the intriguing conclusion that the strength of the bond could depend on the experiment even if the pulling conditions are similar: this paradox was first observed on the widely used streptavidin-biotin bond. Here, by doing supplementary measurements and by reanalyzing the controversial experimental results using Kramers' theory, we show that they can be conciliated. This allows us to show that the strength of a bond is very sensitive to the history of its formation, which is the key to the paradox.


Figures

FIGURE 1
FIGURE 1
Description of the BFP experiment with DNA strands. The spring is a red blood cell whose tension is controlled by the aspiration in the pipette holding it (left pipette). A glass bead coated with DNA strands is attached to this red cell. The DNA is bound to the bead by single streptavidin-biotin bonds. The other pipette holds aggregates of latex particles that nonspecifically bind to the DNA strands. When the glass bead and the latex particles are brought in contact, the DNA strongly attaches to the latex particles. Upon separation, the streptavidin-biotin bond is the first one to unbind. This protocol allows the measurements of rupture forces of bonds that have been given several hours to form.
FIGURE 2
FIGURE 2
Glass beads coated with DNA strands. The left picture shows glass beads in direct illumination. These beads are coated with DNA fluorescently labeled strands. The label is yoyo1. The right picture shows the same beads observed by fluorescence, indicating that the DNA completely covers the beads.
FIGURE 3
FIGURE 3
Experimental curve obtained by Evans' group (adapted from Merkel et al. (2)) of the most likely rupture force of a single streptavidin-biotin bond as a function of the loading rate. Two regimes can be observed as indicated by the two linear slopes.
FIGURE 4
FIGURE 4
Energy landscape of the streptavidin-biotin bond. The landscape used to obtain the probabilities in Fig. 5 with the parameters from Table 1 (shaded line) is superimposed to the one predicted by molecular dynamics (solid lines, given in Merkel et al. (2) and deduced from original data given in Izrailev et al. (17)). In the simulations, the instantaneous energy was computed over a half-nanosecond extraction from the biotin-avidin binding pocket. The denser regions with rapid fluctuations correspond to the minima in the energy landscape, while the heights of the barriers (maxima in the energy landscape) cannot be found. The shaded dashed line represents the inmost barrier that is seen in the DNA experiments but not in the rupture force measurements. The values xm1(0), xm2(0), xm3(0), xb1(0), xb2(0), and xb3(0), are, respectively, the positions of the first, second, and third minimums and of the first, second, and third barriers under zero force. These positions will move when a force is applied.
FIGURE 5
FIGURE 5
Probability density of the rupture force at different loading rates superimposed to the experimental rupture force frequency obtained from Merkel et al. (2). They are deduced by the numerical resolution of the set of master equations, Eqs. 4a and 4b (see text), in the energy landscape given in Fig. 4 and taking P1(0) = 1 and P2(0) = 0. For the curves in solid line, experimental error is taken into account by changing a given rupture force probability density p(f) to an effective rupture force probability density peff(f) by using the relationship formula image where the Gaussian error has a width σ(f), which is inspired by the experiments. Briefly, the force f is equal to kx, where k is the spring constant and x the spring extension. Therefore, df = kdx + xdk = kdx + fdk/k. The value dx is a constant due to the thermal fluctuations and the accuracy on the detection of the position of the bead in the BFP experiments; thus kdx is of the order of 100 pN/μm × 10 nm = 1 pN. The error on k is mainly due to the poor accuracy on various length measurements (inner diameter of the pipette, diameter of the red blood cell, and diameter of the contact between the red cell and the bead, all of the order of 1 μm); it can be estimated to be between 10 and 30%. Following these constraints, we chose σ(f) = Max[10, 0.20 × f] (in pN). (The curves in dashed line represent p(x), meaning that the experimental error is not taken into account. The difference between the solid and dashed lines demonstrates the importance of the experimental error in the analysis.)
FIGURE 6
FIGURE 6
Experimental distributions of the rupture force obtained with the DNA coated beads for two loading rates: 12 pN/s and 2400 pN/s. The corresponding probability density of the rupture forces predicted from the energy landscape given in Fig. 4 and Kramers' equations (Eq. 6a–e) is superimposed. The initial conditions are P1(0) = λ, P2(0) = 1–λ, and P3(0) = 0. Because of small variations in the experiments, λ had to be adjusted with the loading rate. Here, λ = 0.3 for 12 pN/s and 0.6 for 2400 pN/s. Nevertheless, it was always of the order of 0.5. The fit at 12 pN/s is not perfect because of the presence of nonspecific forces that slightly merge with the first peak and artificially decrease the height of the second one after normalization. The experimental error, σ(f), is the same as that used in Fig. 5.
FIGURE 7
FIGURE 7
Experimental distributions of the rupture force obtained with the DNA coated beads in a solution containing biocytin at 0.1 mg/ml to prevent formation of any streptavidin/biotin bond during the measurement. The corresponding probability density of the rupture forces predicted from the energy landscape given in Fig. 4 and Kramers' equations (Eq. 6) is superimposed. The initial conditions are P1(0) = 1, P2(0) = 0, and P3(0) = 0. The experimental error, σ(f), is the same as that used in Fig. 5.
FIGURE 8
FIGURE 8
Filling up of the energy landscape wells. Probability for a bond that is initially in the outermost minimum (minimum number 3 in Fig. 4) to be in a well as a function of time. For each well, there is a sharp transition from fully occupied to empty and from empty to fully occupied at times that are orders-of-magnitude different. These curves are obtained through the master equations, Eqs. 6a–c.
FIGURE 9
FIGURE 9
Average rupture force as a function of the loading rate for a bond that is given 0, 100, or 500 ms before any pulling force is applied (respectively solid, dotted, and dash-dotted lines). Three regimes are observed: 1), Above typically 100 pN/s, the bond is in the second metastable state, the average rupture force increases with the loading rate and the rupture force distributions are the ones given in Fig. 3. 2), Between 5 and 100 pN/s, the lifetime of the bond is longer, more time is given to reach the most favorable state, and therefore, the average rupture force decreases with increasing loading rate. 3), Below 5 pN/s, the bond always reaches the most stable state during the pulling phase; the intermediary metastable state is never observed.
FIGURE 10
FIGURE 10
Average time-span of a single bond as a function of f taken as the inverse of the minimum eigenvalue of the matrix of the master equations, Eqs. 6a–c, at a constant force f: formula imageThe frequencies are obtained like in Eqs. 2a and 2b using the parameters given in Table 1.
FIGURE 11
FIGURE 11
Most likely rupture forces as a function of the loading rate, for both states: the first (higher force, solid triangles) and second deepest (lower force, open triangles) minima. The two observed peaks with the DNA-coated beads experiments correspond to the ones observed by Merkel et al. (2) (second deepest minimum, open squares) and by Yuan et al. (12) (deepest minimum, crosses). They are very well adjusted by the most likely forces predicted from the energy landscape given in Fig. 4 and Eq. 6 (thick and thin solid lines).

References

    1. Florin, E. L., V. T. Moy, and H. E. Gaub. 1994. Adhesion forces between individual ligand-receptor pairs. Science. 264:415–417. - PubMed
    1. Merkel, R., P. Nassoy, A. Leung, K. Ritchie, and E. Evans. 1999. Energy landscapes of receptor-ligand bonds explored with dynamic force spectroscopy. Nature. 397:50–53. - PubMed
    1. Chen, S. Q., and T. A. Springer. 2001. Selectin receptor-ligand bonds: formation limited by shear rate and dissociation governed by the Bell model. Proc. Natl. Acad. Sci. USA. 98:950–955. - PMC - PubMed
    1. Hanley, W., O. McCarty, S. Jadhav, Y. Tseng, D. Wirtz, and K. Konstantopoulos. 2003. Single molecule characterization of P-selectin/ligand binding. J. Biol. Chem. 278:10556–10561. - PubMed
    1. Li, F. Y., S. D. Redick, H. P. Erickson, and V. T. Moy. 2003. Force measurements of the α5β1 integrin-fibronectin interaction. Biophys. J. 84:1252–1262. - PMC - PubMed