. 2005 Dec;89(6):3721-40.
doi: 10.1529/biophysj.105.067397. Epub 2005 Sep 16.

Molecular dynamics simulations of the 136 unique tetranucleotide sequences of DNA oligonucleotides. II: sequence context effects on the dynamical structures of the 10 unique dinucleotide steps

Affiliations

Molecular dynamics simulations of the 136 unique tetranucleotide sequences of DNA oligonucleotides. II: sequence context effects on the dynamical structures of the 10 unique dinucleotide steps

Surjit B Dixit et al. Biophys J. 2005 Dec.

Abstract

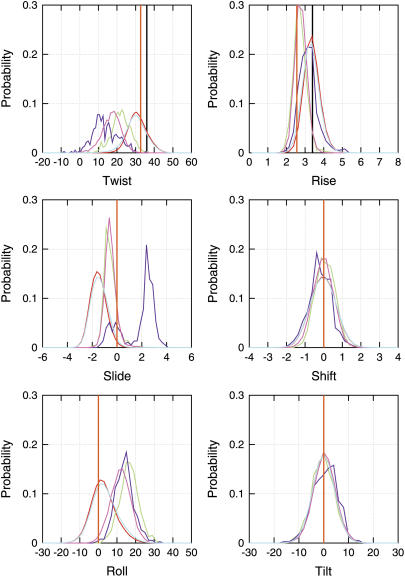
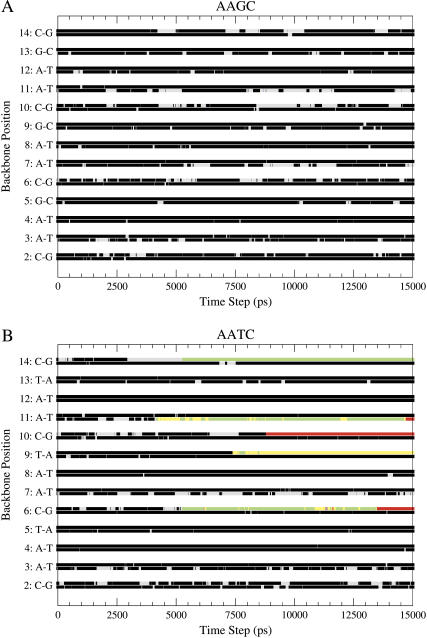
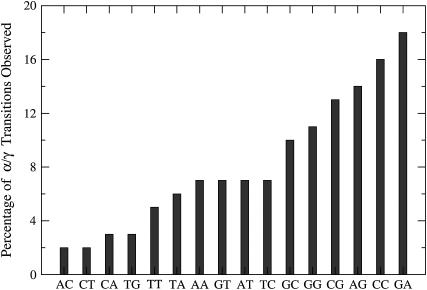
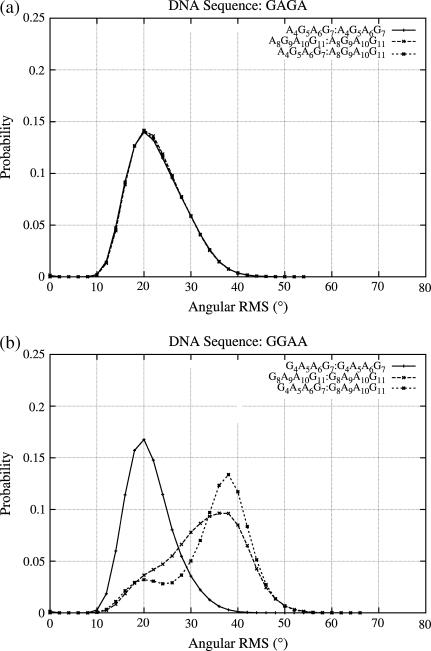
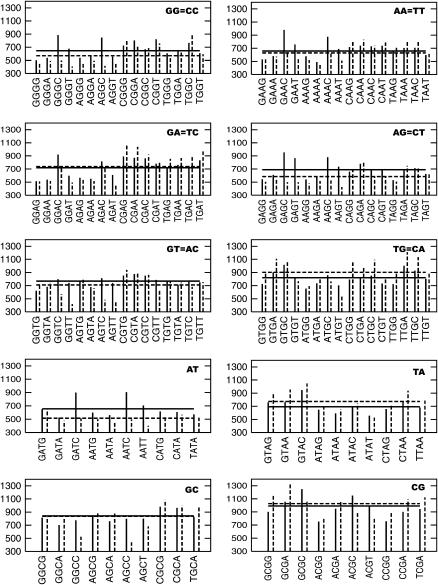
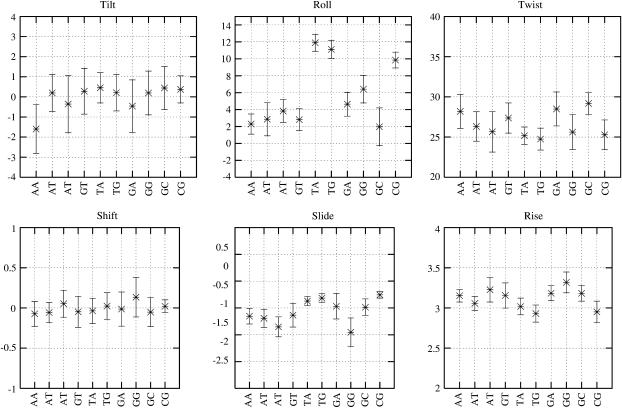
Molecular dynamics (MD) simulations including water and counterions on B-DNA oligomers containing all 136 unique tetranucleotide basepair steps are reported. The objective is to obtain the calculated dynamical structure for at least two copies of each case, use the results to examine issues with regard to convergence and dynamical stability of MD on DNA, and determine the significance of sequence context effects on all unique dinucleotide steps. This information is essential to understand sequence effects on DNA structure and has implications on diverse problems in the structural biology of DNA. Calculations were carried out on the 136 cases embedded in 39 DNA oligomers with repeating tetranucleotide sequences, capped on both ends by GC pairs and each having a total length of 15 nucleotide pairs. All simulations were carried out using a well-defined state-of-the-art MD protocol, the AMBER suite of programs, and the parm94 force field. In a previous article (Beveridge et al. 2004. Biophysical Journal. 87:3799-3813), the research design, details of the simulation protocol, and informatics issues were described. Preliminary results from 15 ns MD trajectories were presented for the d(CpG) step in all 10 unique sequence contexts. The results indicated the sequence context effects to be small for this step, but revealed that MD on DNA at this length of trajectory is subject to surprisingly persistent cooperative transitions of the sugar-phosphate backbone torsion angles alpha and gamma. In this article, we report detailed analysis of the entire trajectory database and occurrence of various conformational substates and its impact on studies of context effects. The analysis reveals a possible direct correspondence between the sequence-dependent dynamical tendencies of DNA structure and the tendency to undergo transitions that "trap" them in nonstandard conformational substates. The difference in mean of the observed basepair step helicoidal parameter distribution with different flanking sequence sometimes differs by as much as one standard deviation, indicating that the extent of sequence effects could be significant. The observations reveal that the impact of a flexible dinucleotide such as CpG could extend beyond the immediate basepair neighbors. The results in general provide new insight into MD on DNA and the sequence-dependent dynamical structural characteristics of DNA.


Figures

FIGURE 1
FIGURE 1
3D plot of DNA backbone conformations in the complete database as a function of α, γ, and (ɛζ) values, showing the presence of distinct substates. The color code is as follows: red, state 1; green, state 2; cyan, state 3; orange, state 4; blue, state 5; yellow, state 6; and pink, state 7. Three levels of isosurface are shown: mesh, transparent, and solid coressponding to population densities of 1, 10, and 10,000, respectively.
FIGURE 2
FIGURE 2
Schematic of the various conformational states observed in the DNA backbone and the observed transitions between them. The size of the circles is approximately proportional to the population of the various conformational substates, and the thickness of the lines is roughly proportional to the number of transitions observed. The shaded arrows are highly unbalanced in directionality.
FIGURE 3
FIGURE 3
The ln(frequency) of lifetimes in states BI and BII shown with “plus” sign and BII to BI shown with the “cross” sign as a function of the lifetime (in 100 ps) in the starting state. The slope of the line gives the mean lifetime in states BI and BII, respectively.
FIGURE 4
FIGURE 4
Probability distribution of the DNA conformational angles α, β, γ, ɛ, ζ, δ, and χ, and the amplitude (A) and phase (P) of the sugar. The solid line presents the normalized probability distribution plotted with reference to the primary y axis, and the dotted line presents the same data on the log scale shown in the secondary y axis.
FIGURE 5
FIGURE 5
Normalized probability distribution of the six interbasepair step parameters, classified on the basis of the conformational state of the neighboring 3′ side backbone angles of the two DNA strands. Cases where the backbone conformation of both the strands in state 1 is shown in red, state 2 in green, state 3 in blue, and state 7 in pink. The distribution in the complete database is shown in cyan. Note that since the normalized probability distributions for each of the state distributions are plotted, the heights of the curves appear the same but the fraction of population in each of the states is not the same.
FIGURE 6
FIGURE 6
Plot depicting the occurrence of the seven backbone conformational substates at all the backbone positions in the DNA sequence over the complete 15 ns trajectory. The status of the backbone conformations in two strands at each position is shown in the two lines, the lower one for the first strand and the higher line for the second strand. The data for two trajectories based on the (A) AAGC and (B) AATC sequences are shown. The color code is as follows: black, state 1; red, state 2; green, state 3; blue, state 4; yellow, state 5; brown, state 6; and gray, state 7.
FIGURE 7
FIGURE 7
Percentage of the phosphodiester backbone positions that transition to a nonstandard conformational state for all the dinucleotide steps in the simulated database.
FIGURE 8
FIGURE 8
Normalized probability distribution of the angular RMS differences between copies of the tetranucleotides at a particular position and comparison with the structures of the same tetranucleotide at different positions along the DNA sequence. Top image compares A4G5A6G7 and A8G9A10G11 tetranucleotides in the DNA sequence GAGA, and bottom image compares the G4A5A6G7 and G8A9A10G11 tetranucleotides in the DNA sequence GGAA.
FIGURE 9
FIGURE 9
DKL between the RMS probability plots for the various dinucleotide steps in states 1 and 7. The smooth curve plotted with reference to the secondary x axis shows the cumulative percentage of all the dinucleotide pairs with a DKL less than any particular value.
FIGURE 10
FIGURE 10
2D matrix plot showing DKL between all pairs of the dinucleotides with different flanking sequences. (A) The central dinucleotide is GT. (B) The central dinucleotide is TG. The light green shades indicate low DKL and hence similar structures, and the shades of blue indicate differences in structure. Data from only states 1 and 7 were used in this plot.
FIGURE 11
FIGURE 11
DKL between the RMS probability plots for the various dinucleotide steps in the database after neglecting all cases which were involved in α/γ transitions.
FIGURE 12
FIGURE 12
Comparison of the six interbasepair step properties of the dinucleotide steps TpG and GpT with all the possible unique flanking sequences. The data presented here are the mean and one standard deviation of the respective parameters, considering only the snapshots with the α/γ backbone conformation close to the canonical state, i.e., g−/g+.
FIGURE 13
FIGURE 13
Mean-square fluctuations in the backbone conformational angles of each of the 10 unique dinucleotide steps and all their corresponding tetranucleotides. The solid vertical lines present the average mean square fluctuations from the Pinter and Pintra RMSD for each tetranucleotide step, and the corresponding dinucleotide data are shown as a dotted line. The solid and dotted horizontal lines are the average of all the tetranucleotide and dinucleotide data in the graph, respectively.
FIGURE 14
FIGURE 14
Average basepair step values observed in the MD simulation database for all the unique dinucleotide steps and the standard deviation in the data as a result of different flanking steps. Data from only states 1 and 7 were used in this plot.

References

    1. Miller, J. L., T. E. Cheatham III, and P. A. Kollman. 1999. Simulation of nucleic acid structure. In Oxford Handbook of Nucleic Acid Structure. S. Neidle, editor. Oxford University Press, Oxford, New York. 95–115.
    1. Beveridge, D. L., and K. J. McConnell. 2000. Nucleic acids: theory and computer simulation, Y2K. Curr. Opin. Struct. Biol. 10:182–196. - PubMed
    1. Cheatham 3rd, T. E., and P. A. Kollman. 2000. Molecular dynamics simulation of nucleic acids. Annu. Rev. Phys. Chem. 51:435–471. - PubMed
    1. Giudice, E., and R. Lavery. 2002. Simulations of nucleic acids and their complexes. Acc. Chem. Res. 35:350–357. - PubMed
    1. Orozco, M., A. Perez, A. Noy, and F. J. Luque. 2003. Theoretical methods for the simulation of nucleic acids. Chem. Soc. Rev. 32:350–364. - PubMed

LinkOut - more resources