. 2005 Dec;89(6):4188-200.
doi: 10.1529/biophysj.105.065805. Epub 2005 Sep 16.

The conformational stability and thermodynamics of Fur A (ferric uptake regulator) from Anabaena sp. PCC 7119

Affiliations

The conformational stability and thermodynamics of Fur A (ferric uptake regulator) from Anabaena sp. PCC 7119

José A Hernández et al. Biophys J. 2005 Dec.

Abstract

Fur (ferric uptake regulator) is a key bacterial protein that regulates iron acquisition and its storage, and modulates the expression of genes involved in the response to different environmental stresses. Although the protein is involved in several regulation mechanisms, and members of the Fur family have been identified in pathogen organisms, the stability and thermodynamic characterization of a Fur protein have not been described. In this work, the stability, thermodynamics and structure of the functional dimeric Fur A from Anabaena sp. PCC 7119 were studied by using computational methods and different biophysical techniques, namely, circular dichroism, fluorescence, Fourier-transform infrared, and nuclear magnetic resonance spectroscopies. The structure, as monitored by circular dichroism and Fourier-transform infrared, was composed of a 40% of alpha-helix. Chemical-denaturation experiments indicated that Fur A folded via a two-state mechanism, but its conformational stability was small with a value of DeltaG = 5.3 +/- 0.3 kcal mol(-1) at 298 K. Conversely, Fur A was thermally a highly stable protein. The high melting temperature (Tm = 352 +/- 5 K), despite its moderate conformational stability, can be ascribed to its low heat capacity change upon unfolding, DeltaCp, which had a value of 0.8 +/- 0.1 kcal mol(-1) K(-1). This small value is probably due to burial of polar residues in the Fur A structure. This feature can be used for the design of mutants of Fur A with impaired DNA-binding properties.


Figures
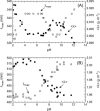
FIGURE 1
FIGURE 1
The pH-induced unfolding of Fur A followed by intrinsic and ANS fluorescence. (A) Intrinsic fluorescence: The 〈λ〉 (right axis, solid squares) and the maxima wavelength (left axis, open squares) are represented versus the pH. Protein concentration was 2 μM, in 100 μM of DTT. (B) ANS-binding experiments: The maxima wavelength (left axis, open squares) and the 〈λ〉 (right axis, solid squares) are represented versus the pH. Protein concentration was 2 μM and ANS concentration was 100 μM, in 100 μM of DTT. All the experiments were acquired at 298 K.
FIGURE 2
FIGURE 2
Far- and near-UV CD. (A) Far-UV CD, as measured by following the mean residue ellipticity at 222 nm. (Inset) Far-UV CD spectrum of Fur at pH 2.0, 6.0, and 10. Protein concentration was 15 μM in 100 μM of DTT. All the experiments were acquired at 298 K. (B) Near-UV CD of Fur A at pH 7 (continuous line) and pH 10 (dashed line). Protein concentration was 38 μM with 400 μM of DTT. All the experiments were acquired at 298 K.
FIGURE 3
FIGURE 3
Trypsin digestion experiments. Changes in the Fur A intensity band in a SDS-PAGE gel at different times since the beginning of the reaction digestion. The measurements were repeated four times at the different pH values.
FIGURE 4
FIGURE 4
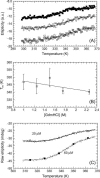
Thermal denaturation of Fur A. (A) Far-UV CD at pH 4, in the presence of different amounts of GdmHCl by following the change in ellipticity at 222 nm: [GdmHCl] = 1.25 M (open squares), [GdmHCl] = 1.75 M (open circles), and [GdmHCl] = 2.25 M (solid squares). The lines through the data are the fittings to Eqs. 5 and 6. Protein concentration was 15 μM in 100 μM of DTT in all cases. The scale on the y axis is arbitrary. (B) Extrapolation of Tm at zero denaturant concentration from the data in plot A. Error bars are fitting errors to Eqs. 5 and 6. (C) Far-UV CD at pH 4, 2.25 M GdmHCl at 20, and 60 μM. The Tm were 342 ± 1 K for 20 μM and 345.6 ± 0.7 K for 60 μM. The solid lines through the data are the nonlinear least-squares fits to Eq. 5, with the free energy given by Eq. 6. The scale on the y axis is arbitrary.
FIGURE 5
FIGURE 5
DOSY-NMR experiments. (A) The logarithm of the normalized intensity of the most upfield-shifted peaks is shown as a function of the squares of the gradient strength at two selected concentrations: 950 μM (continuous line and open squares) and 475 μM (dotted line and solid squares). The slopes of the plots give the apparent diffusion constant of the molecule in solution at the particular concentration used. (B) NMR diffusion coefficients of Fur A as a function of protein concentration. The bars are fitting errors to the linear equations shown in A. The solid line is the fitting to a linear equation whose y-axis intercept yields the diffusion coefficient in an ideal solution (i.e., at 0 M of protein concentration). The concentration of DTT was 1 mM in all cases at pH 4.
FIGURE 6
FIGURE 6
Three-dimensional model of the structure of Fur A. Ribbon representation of the homology model of Fur A based on P. aeruginosa crystal structure (PDB code 1mzb) (22). The helical-rich N-terminus is colored in green and the C-terminus in magenta. Trp18 and its neighboring residues are displayed in stick representation. (Color code: light gray, carbon; blue, nitrogen; red, oxygen; green, sulfur; and dark gray, hydrogen.) Only polar hydrogens are displayed.
FIGURE 7
FIGURE 7
The GdmHCl-denaturation of Fur A at pH 4 at different protein concentrations. CD raw data (left axis, solid circles) at 50 μM protein concentration and fluorescence raw data (right axis, open circles) at 0.5 μM protein concentration in the presence of DTT (150 μM for CD and 20 μM for fluorescence). Fitting to Eq. 5 resulted in a [GdmHCl]1/2 = 3.9 ± 0.1 M (fluorescence), and [GdmHCl]1/2 = 4.0 ± 0.4 M (CD).
FIGURE 8
FIGURE 8
The thermodynamical parameters of the chemical denaturation of Fur A at pH 4. (A) Temperature dependence of the m-value from fluorescence measurements. The errors bars are fitting errors to the LEM. (B) The temperature dependence of the [GdmHCl]1/2 (left side, open squares) and ΔG (right side, solid squares) values. The errors bars are fitting errors to the LEM. The errors are larger at the higher temperatures, because the native baselines in the chemical-denaturation experiments were shorter. The line through the ΔG data is the fitting to Eq. 6. The value of the Tm (right side, where ΔG equals zero) was obtained from the extrapolation of thermal-denaturation experiments (Fig. 4 B). The ΔG values were obtained with the mean of the m-value over all the temperatures (1.3 ± 0.1 kcal mol−1 M−1). The temperature dependence of ΔG was consistent with a temperature-independent heat capacity change, ΔCp, of 0.8 ± 0.1 kcal mol−1 K−1.

References

    1. Braun, V., and H. Killmann. 1999. Bacterial solutions to the iron supply problem. Trends Biochem. Sci. 24:104–109. - PubMed
    1. Litwin, C. M., and S. B. Calderwood. 1993. Role of iron in regulation of virulence genes. Clin. Microbiol. Rev. 6:137–149. - PMC - PubMed
    1. Ratledge, C., and L. G. Dover. 2000. Iron metabolism in pathogenic bacteria. Annu. Rev. Microbiol. 54:881–941. - PubMed
    1. Escolar, L., V. de Lorenzo, and J. Pérez-Martín. 1997. Metalloregulation in vitro of the aerobactin promoter of Escherichia coli by the Fur (ferric uptake regulator) protein. Mol. Microbiol. 26:799–808. - PubMed
    1. Dubrac, S., and D. Touati. 2000. Fur positive regulation of iron superoxide dismutase in Escherichia coli: functional analysis of the sodB promoter. J. Bacteriol. 182:3802–3808. - PMC - PubMed

Publication types

Substances

LinkOut - more resources