

Backbone and side chain dynamics of mutant calmodulin-peptide complexes
- PMID: 16171378
- PMCID: PMC1343484
- DOI: 10.1021/bi050832f
Backbone and side chain dynamics of mutant calmodulin-peptide complexes
Abstract
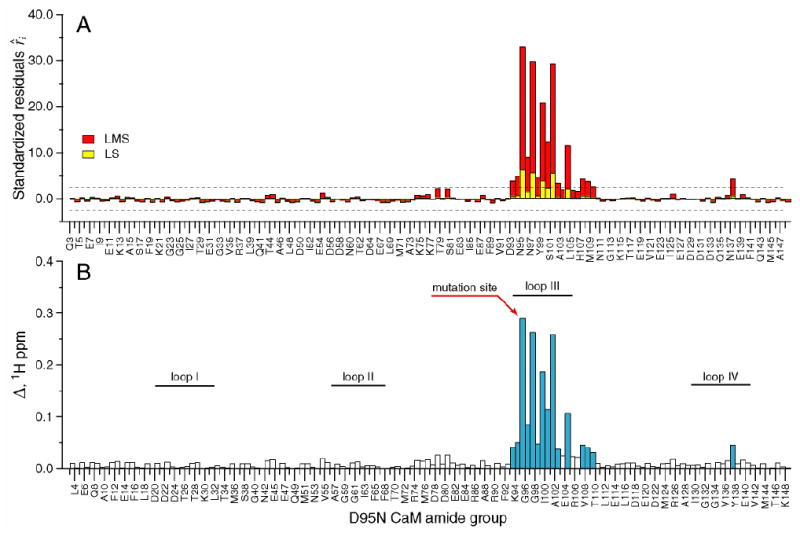
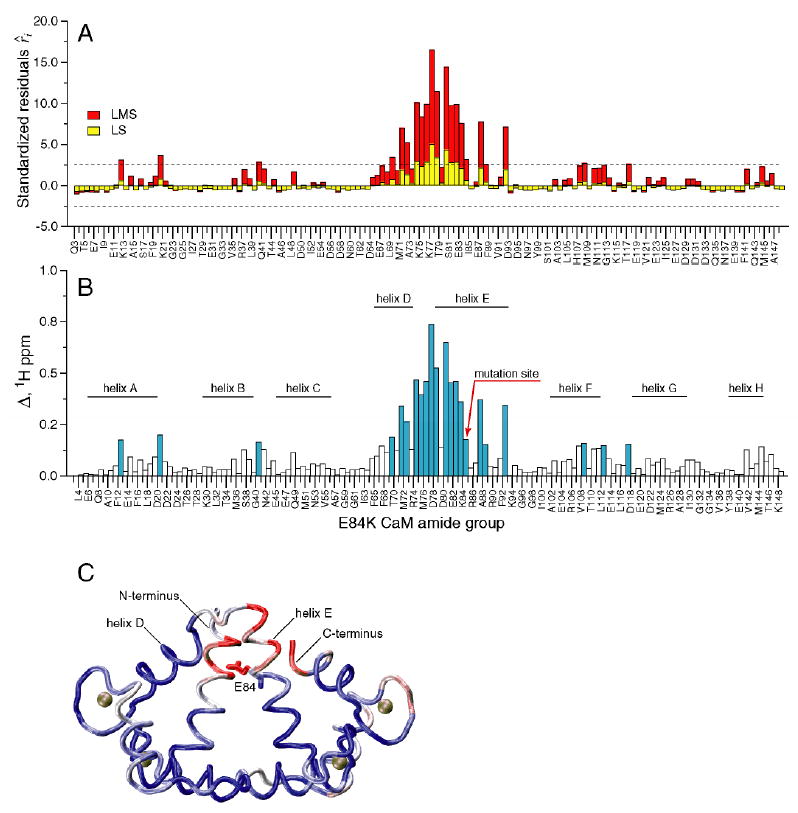
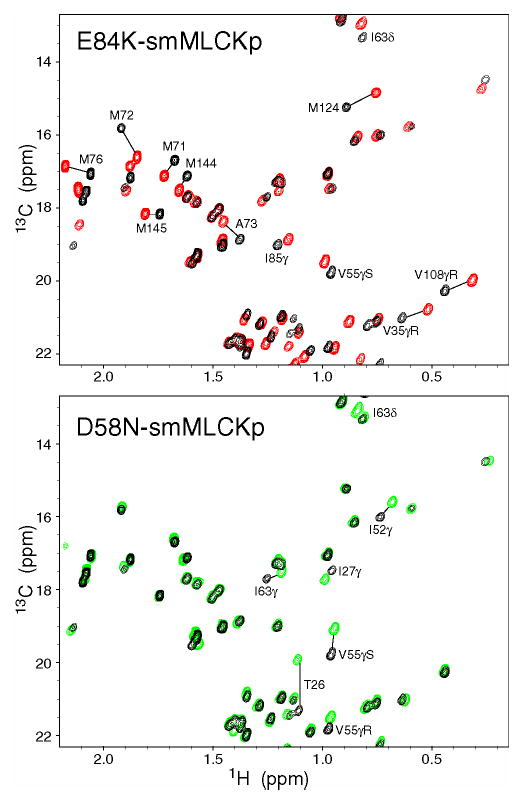
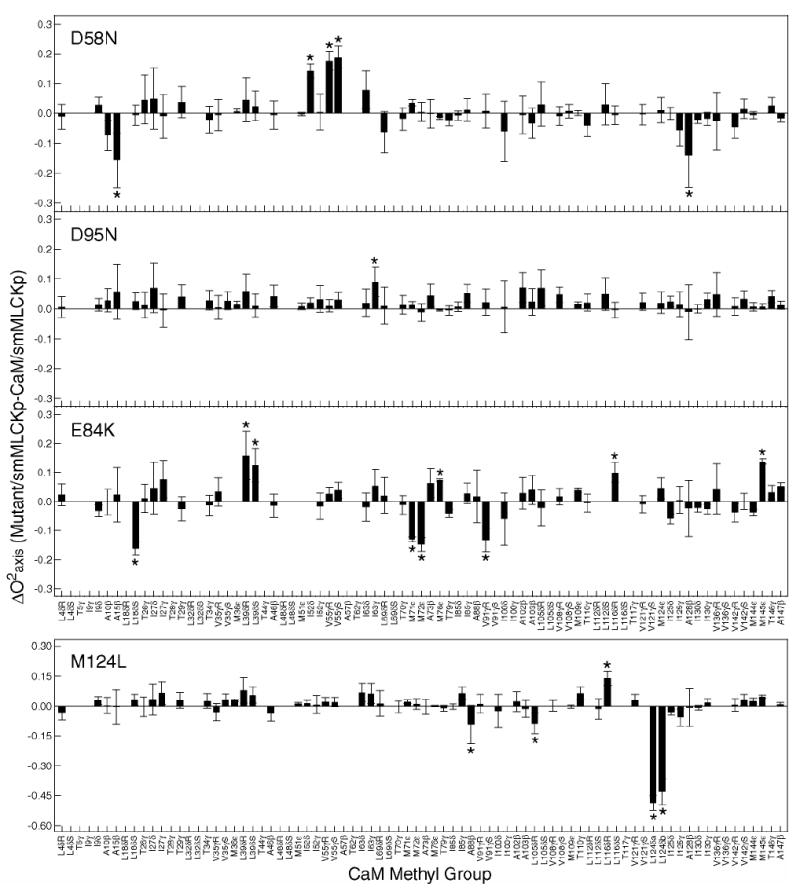
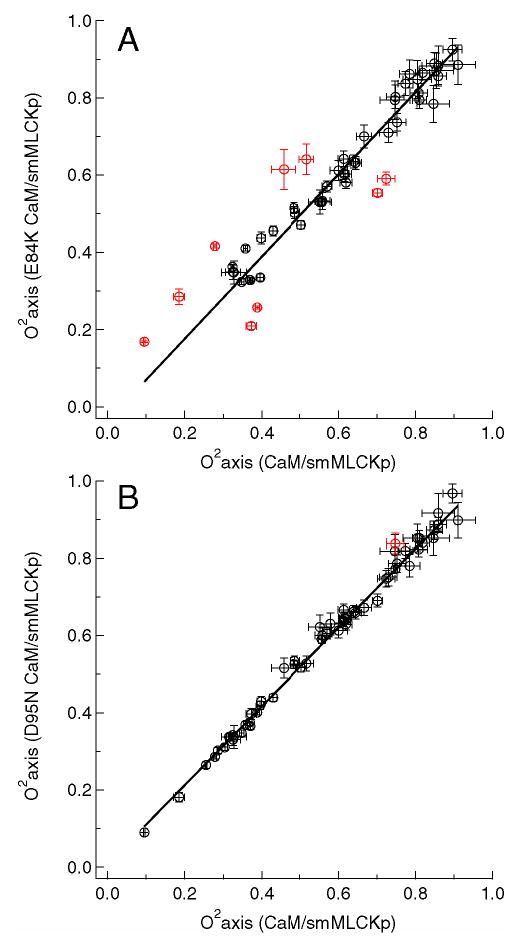
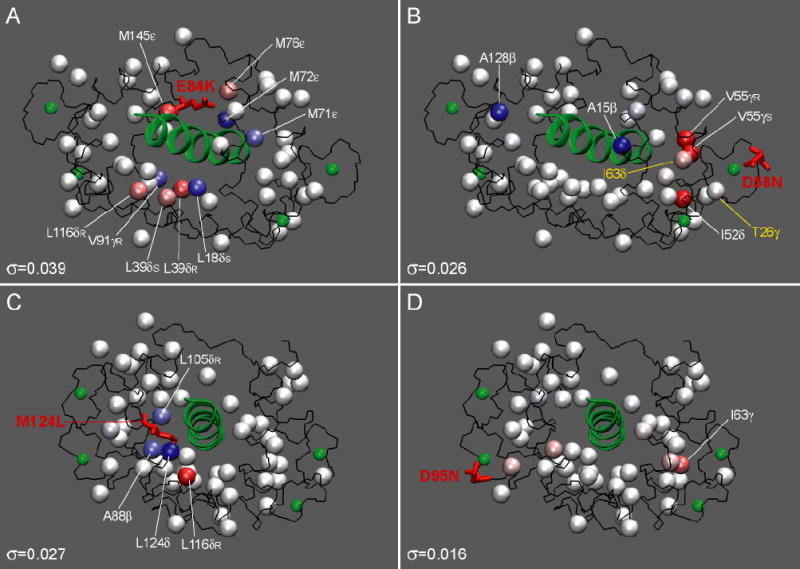
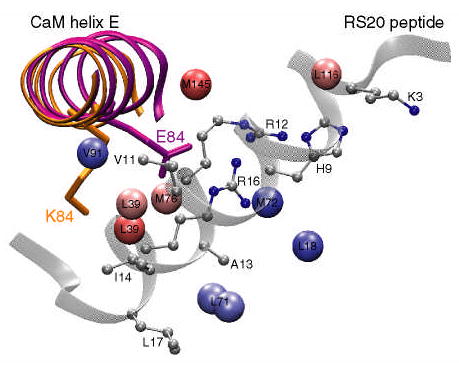
The mechanism of long-range coupling of allosteric sites in calcium-saturated calmodulin (CaM) has been explored by characterizing structural and dynamics effects of mutants of calmodulin in complex with a peptide corresponding to the smooth muscle myosin light chain kinase calmodulin-binding domain (smMLCKp). Four CaM mutants were examined: D95N and D58N, located in Ca2+-binding loops; and M124L and E84K, located in the target domain-binding site of CaM. Three of these mutants have altered allosteric coupling either between Ca2+-binding sites (D58N and D95N) or between the target- and Ca2+-binding sites (E84K). The structure and dynamics of the mutant calmodulins in complex with smMLCKp were characterized using solution NMR. Analysis of chemical shift perturbations was employed to detect largely structural perturbations. 15N and 2H relaxation was employed to detect perturbations of the dynamics of the backbone and methyl-bearing side chains of calmodulin. The least median squares method was found to be robust in the detection of perturbed sites. The main chain dynamics of calmodulin are found to be largely unresponsive to the mutations. Three mutants show significantly perturbed dynamics of methyl-bearing side chains. Despite the pseudosymmetric location of Ca2+-binding loop mutations D58N and D95N, the dynamic response of CaM is asymmetric, producing long-range perturbation in D58N and almost none in D95N. The mutations located at the target domain-binding site have quite different effects. For M124L, a local perturbation of the methyl dynamics is observed, while the E84K mutation produces a long-range propagation of dynamic perturbations along the target domain-binding site.
Figures
Similar articles
-
Characterization of the backbone and side chain dynamics of the CaM-CaMKIp complex reveals microscopic contributions to protein conformational entropy.Biochemistry. 2006 Aug 15;45(32):9841-8. doi: 10.1021/bi060865a. Biochemistry. 2006. PMID: 16893184
-
Identification of Mg2+-binding sites and the role of Mg2+ on target recognition by calmodulin.Biochemistry. 1997 Apr 8;36(14):4309-16. doi: 10.1021/bi962759m. Biochemistry. 1997. PMID: 9100027
-
Analysis of the functional coupling between calmodulin's calcium binding and peptide recognition properties.Biochemistry. 1999 Mar 30;38(13):3936-47. doi: 10.1021/bi9821263. Biochemistry. 1999. PMID: 10194305
-
Structural diversity of calmodulin binding to its target sites.FEBS J. 2013 Nov;280(21):5551-65. doi: 10.1111/febs.12296. Epub 2013 May 13. FEBS J. 2013. PMID: 23601118 Review.
-
Nuclear magnetic resonance studies of protein-peptide complexes.Methods Enzymol. 1994;239:700-17. doi: 10.1016/s0076-6879(94)39026-6. Methods Enzymol. 1994. PMID: 7830602 Review. No abstract available.
Cited by
-
Characterization of the fast dynamics of protein amino acid side chains using NMR relaxation in solution.Chem Rev. 2006 May;106(5):1672-99. doi: 10.1021/cr040422h. Chem Rev. 2006. PMID: 16683749 Free PMC article. Review. No abstract available.
-
Binding Mechanism of the N-Terminal SH3 Domain of CrkII and Proline-Rich Motifs in cAbl.Biophys J. 2016 Jun 21;110(12):2630-2641. doi: 10.1016/j.bpj.2016.05.008. Biophys J. 2016. PMID: 27332121 Free PMC article.
-
Detection of nanosecond time scale side-chain jumps in a protein dissolved in water/glycerol solvent.J Biomol NMR. 2009 Sep;45(1-2):57-72. doi: 10.1007/s10858-009-9336-9. Epub 2009 Jul 7. J Biomol NMR. 2009. PMID: 19582374
-
The ensemble nature of allostery.Nature. 2014 Apr 17;508(7496):331-9. doi: 10.1038/nature13001. Nature. 2014. PMID: 24740064 Free PMC article. Review.
-
Changes in Lysozyme Flexibility upon Mutation Are Frequent, Large and Long-Ranged.PLoS Comput Biol. 2012;8(3):e1002409. doi: 10.1371/journal.pcbi.1002409. Epub 2012 Mar 1. PLoS Comput Biol. 2012. PMID: 22396637 Free PMC article.
References
-
- Perutz MF. Stereochemistry of cooperative effects in haemoglobin. Nature. 1970;228:726–39. - PubMed
-
- Fersht, A. (1995) Enzyme structure and mechanism, W. H. Freeman and company, New York.
-
- Goldsmith EJ. Allosteric enzymes as models for chemomechanical energy transducing assemblies. FASEB J. 1996;10:702–708. - PubMed
-
- Changeux JP, Edelstein SJ. Allosteric receptors after 30 years. Neuron. 1998;21:959–980. - PubMed
Publication types
MeSH terms
Substances
Grants and funding
LinkOut - more resources
Full Text Sources
Other Literature Sources
Miscellaneous
