Cortical sensitivity to visual features in natural scenes
- PMID: 16171408
- PMCID: PMC1233414
- DOI: 10.1371/journal.pbio.0030342
Cortical sensitivity to visual features in natural scenes
Abstract
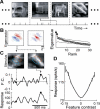
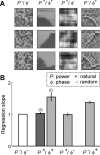
A central hypothesis concerning sensory processing is that the neuronal circuits are specifically adapted to represent natural stimuli efficiently. Here we show a novel effect in cortical coding of natural images. Using spike-triggered average or spike-triggered covariance analyses, we first identified the visual features selectively represented by each cortical neuron from its responses to natural images. We then measured the neuronal sensitivity to these features when they were present in either natural images or random stimuli. We found that in the responses of complex cells, but not of simple cells, the sensitivity was markedly higher for natural images than for random stimuli. Such elevated sensitivity leads to increased detectability of the visual features and thus an improved cortical representation of natural scenes. Interestingly, this effect is due not to the spatial power spectra of natural images, but to their phase regularities. These results point to a distinct visual-coding strategy that is mediated by contextual modulation of cortical responses tuned to the spatial-phase structure of natural scenes.
Figures


Similar articles
-
A higher order visual neuron tuned to the spatial amplitude spectra of natural scenes.Nat Commun. 2015 Oct 6;6:8522. doi: 10.1038/ncomms9522. Nat Commun. 2015. PMID: 26439748 Free PMC article.
-
Isolation of relevant visual features from random stimuli for cortical complex cells.J Neurosci. 2002 Dec 15;22(24):10811-8. doi: 10.1523/JNEUROSCI.22-24-10811.2002. J Neurosci. 2002. PMID: 12486174 Free PMC article.
-
Processing of complex stimuli and natural scenes in the visual cortex.Curr Opin Neurobiol. 2004 Aug;14(4):468-73. doi: 10.1016/j.conb.2004.06.002. Curr Opin Neurobiol. 2004. PMID: 15302353 Review.
-
Timing precision in population coding of natural scenes in the early visual system.PLoS Biol. 2008 Dec 16;6(12):e324. doi: 10.1371/journal.pbio.0060324. PLoS Biol. 2008. PMID: 19090624 Free PMC article.
-
Efficient coding of natural images.Sheng Li Xue Bao. 2011 Oct 25;63(5):463-71. Sheng Li Xue Bao. 2011. PMID: 22002237 Review.
Cited by
-
The statistical computation underlying contrast gain control.J Neurosci. 2006 Jun 7;26(23):6346-53. doi: 10.1523/JNEUROSCI.0284-06.2006. J Neurosci. 2006. PMID: 16763043 Free PMC article.
-
Primary visual cortex represents the difference between past and present.Cereb Cortex. 2015 Jun;25(6):1427-40. doi: 10.1093/cercor/bht318. Epub 2013 Dec 15. Cereb Cortex. 2015. PMID: 24343889 Free PMC article.
-
Synapse-type-specific competitive Hebbian learning forms functional recurrent networks.Proc Natl Acad Sci U S A. 2024 Jun 18;121(25):e2305326121. doi: 10.1073/pnas.2305326121. Epub 2024 Jun 13. Proc Natl Acad Sci U S A. 2024. PMID: 38870059 Free PMC article.
-
Speed dependence of tuning to one-dimensional features in V1.J Neurophysiol. 2007 Mar;97(3):2423-38. doi: 10.1152/jn.00713.2006. Epub 2007 Jan 24. J Neurophysiol. 2007. PMID: 17251369 Free PMC article.
-
A Single-Neuron: Current Trends and Future Prospects.Cells. 2020 Jun 23;9(6):1528. doi: 10.3390/cells9061528. Cells. 2020. PMID: 32585883 Free PMC article. Review.
References
-
- Attneave F. Some informational aspects of visual perception. Psychol Rev. 1954;51:183–193. - PubMed
-
- Field DJ. Relations between the statistics of natural images and the response properties of cortical cells. J Opt Soc Am A Opt Image Sci Vis. 1987;4:2379–2394. - PubMed
-
- Atick JJ. Could information processing provide an ecological theory of sensory processing? Network. 1992;3:213–251. - PubMed
-
- Field DJ. What is the goal of sensory coding? Neural Comput. 1994;6:559–601.
-
- Thomson MG. Beats, kurtosis and visual coding. Network. 2001;12:271–287. - PubMed

