. 2005 Sep 26;170(7):1159-67.
doi: 10.1083/jcb.200503157. Epub 2005 Sep 19.

Cell adhesion molecules regulate Ca2+-mediated steering of growth cones via cyclic AMP and ryanodine receptor type 3

Affiliations

Cell adhesion molecules regulate Ca2+-mediated steering of growth cones via cyclic AMP and ryanodine receptor type 3

Noriko Ooashi et al. J Cell Biol. .

Abstract

Axonal growth cones migrate along the correct paths during development, not only directed by guidance cues but also contacted by local environment via cell adhesion molecules (CAMs). Asymmetric Ca2+ elevations in the growth cone cytosol induce both attractive and repulsive turning in response to the guidance cues (Zheng, J.Q. 2000. Nature. 403:89-93; Henley, J.R., K.H. Huang, D. Wang, and M.M. Poo. 2004. Neuron. 44:909-916). Here, we show that CAMs regulate the activity of ryanodine receptor type 3 (RyR3) via cAMP and protein kinase A in dorsal root ganglion neurons. The activated RyR3 mediates Ca2+-induced Ca2+ release (CICR) into the cytosol, leading to attractive turning of the growth cone. In contrast, the growth cone exhibits repulsion when Ca2+ signals are not accompanied by RyR3-mediated CICR. We also propose that the source of Ca2+ influx, rather than its amplitude or the baseline Ca2+ level, is the primary determinant of the turning direction. In this way, axon-guiding and CAM-derived signals are integrated by RyR3, which serves as a key regulator of growth cone navigation.


Figures
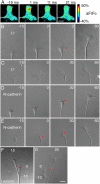
Figure 1.
Figure 1.
Ca2 + -induced growth cone turning on different substrates. (A) A localized and transient [Ca2+]c elevation is produced by single FLIP of NP-EGTA in a chick DRG growth cone. Shown is the time course of the Ca2+ signal (CG-1 ΔF/F0 in pseudocolor). Each image was acquired by a 10-ms exposure starting at the indicated time point after the laser shot. Bar, 10 μm. Time-lapse DIC images showing Ca2+-induced growth cone turning on L1 (B and C), N-cadherin (D and E), or laminin (F and G). Rp-cAMPS (C and E) or Sp-cAMPS (G) was added to the culture media. Loaded NP-EGTA in the growth cone was uncaged every 3 s by laser irradiation at the red spot. Digits represent minutes after the onset of repetitive FLIP. Growth cone images on laminin at different time points were superimposed (F and G). Bar, 10 μm.
Figure 2.
Figure 2.
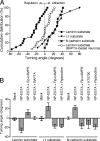
Involvement of cAMP and RyRs in Ca2 + -induced growth cone turning. (A) The distribution of turning angles of chick DRG growth cones on the three different substrates. Focal Ca2+ signals were produced on one side of the growth cones by repetitive FLIP of NP-EGTA. Each point represents the percentage of growth cones with turning angles equal to or smaller than that indicated on the abscissa. As a control, loading of BAPTA canceled FLIP-induced growth cone turning. (B) The average turning angles of growth cones on the three different substrates. Treatment of growth cones with the indicated drugs (Sp-cAMPS, Rp-cAMPS, ryanodine, or KT5720) reversed the turning responses to Ca2+ signals. Growth cones without NP-EGTA loading (blank) did not show a directional response to repetitive laser irradiation. Error bars represent 11–21 growth cones.
Figure 3.
Figure 3.
CAMs regulate cAMP activities in growth cones. (A) Competitive immunoassays showing intracellular cAMP levels in chick DRG neurons on L1, N-cadherin, or laminin. *, P < 0.05; ***, P < 0.001; compared with a laminin substrate (n = 7). (B) FlCRhR ratio images (F520/F580 in pseudocolor) showing cytosolic cAMP activities in chick DRG growth cones on L1, N-cadherin, or laminin. Bar, 10 μm. (C) Measurements of cAMP activities in growth cones on the three different substrates. The F520/F580 values of FlCRhR were averaged in growth cones. Error bars represent 26–32 growth cones. **, P < 0.01; ***, P < 0.001; compared with a laminin substrate.
Figure 4.
Figure 4.
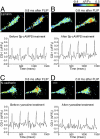
Pharmacological dissection of different components of Ca2 + signals induced by NP-EGTA photolysis. (A and B) Sp-cAMPS augments FLIP-induced Ca2+ signals in a chick DRG growth cone on laminin. Before and after a 5-min treatment with Sp-cAMPS (A and B, respectively), the Ca2+ signals were analyzed in the same growth cone under the same FLIP conditions. CG-1 fluorescence was imaged at the exposure of 15.7 ms. The pseudocolor images show ΔF/F0 immediately before or 0.8 ms after single FLIP. The ΔF/F0 values were averaged within a 2-μm-diam zone centered by the FLIP site and plotted as a function of time. The graphs show five Ca2+ elevations (ΔF/F0 spikes) induced by five laser pulses at 300-ms intervals. Note that the amplitude of the Ca2+ signals is augmented by the Sp-cAMPS treatment (compare A and B). (C and D) A high dose of ryanodine attenuates FLIP-induced Ca2+ signals in a growth cone on N-cadherin. The amplitude of Ca2+ signals was analyzed in the same growth cone before and after a 5-min treatment with 100 μM ryanodine (C and D, respectively), using experimental methods described in A and B. Bar, 5 μm.
Figure 5.
Figure 5.
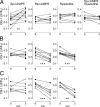
CAMs influence RyR-mediated CICR via cAMP. The effects of the indicated drugs on FLIP-induced Ca2+ signals were analyzed in chick DRG growth cones on laminin (A), L1 (B), or N-cadherin (C). As exemplified in Fig. 4, the amplitude of ΔF/F0 spikes was defined as ΔF/F0 values averaged within a 2-μm-diam zone immediately after FLIP. The amplitude of five ΔF/F0 spikes induced by five laser pulses at 300-ms intervals was averaged and plotted as the ordinate. The abscissa indicates the minutes after an application of Sp-cAMPS, Rp-cAMPS, and/or ryanodine. Each line represents a drug-induced change of the Ca2+-signal amplitude in a single growth cone. Datasets with statistically significant changes are marked by asterisks. **, P < 0.01; ***, P < 0.001; paired t test.
Figure 6.
Figure 6.
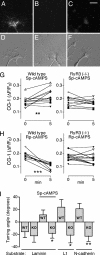
Ca2 + signals and turning directions of RyR3-deficient growth cones. (A–F) Immunocytochemistry of RyRs in mouse DRG neurons. RyRs in wild-type (A and D) or RyR3-deficient (C and F) growth cones were labeled with an antibody that recognized all three isoforms. As a control, the primary antibody was omitted from the labeling procedure on wild-type growth cones (B and E). Shown are RyR immunofluorescence (A–C) and DIC images (D–F). Bar, 10 μm. (G and H) FLIP-induced Ca2+ signals in wild-type and RyR3-deficient growth cones. As described in Fig. 5, the effects of drugs (Sp-cAMPS or Rp-cAMPS) on the ΔF/F0 spike amplitude were analyzed in growth cones on laminin (G) or L1 (H). Each line represents a drug-induced change of the amplitude in a single growth cone. Datasets with statistically significant changes are marked by asterisks. **, P < 0.01; ***, P < 0.001; paired t test. (I) The average turning angles of wild-type (WT) or RyR3-knockout (KO) growth cones on the three different substrates. As indicated, some growth cones were analyzed in the presence of Sp-cAMPS. Error bars represent 9–15 growth cones. *, P < 0.05; **, P < 0.01; compared with wild-type growth cones under the same culture conditions.
Figure 7.
Figure 7.
The relationship between the Ca2 + -signal amplitude and growth cone turning. The amplitude of FLIP-induced Ca2+ signals was controlled by preloading chick neurons with increasing concentrations of BAPTA. Blue dots indicate the mean amplitude of ΔF/F0 spikes that was calculated as described in Fig. 5. Each dot involves 6–10 growth cones. Red diamonds indicate the mean turning angles, each involving 8–13 growth cones. *, P < 0.05; **, P < 0.01; ***, P < 0.001; compared with the turning angles of growth cones that were not loaded with NP-EGTA.
Figure 8.
Figure 8.
CGRP-positive axon trajectories in the spinal cords. Nociceptive DRG axons were labeled by CGRP immunofluorescence. Shown are transverse sections of the spinal cord at the fifth lumbar segment from wild-type (A and B) or RyR3-knockout (C and D) mice. Dorsal is uppermost, and the arrows indicate the central canal. Bar, 200 μm.

Similar articles

Cited by

References

    1. Adams, S.R., A.T. Harootunian, Y.J. Buechler, S.S. Taylor, and R.Y. Tsien. 1991. Fluorescence ratio imaging of cyclic AMP in single cells. Nature. 349:694–697. - PubMed
    1. Augustine, G.J., F. Santamaria, and K. Tanaka. 2003. Local calcium signaling in neurons. Neuron. 40:331–346. - PubMed
    1. Averill, S., S.B. McMahon, D.O. Clary, L.F. Reichardt, and J.V. Priestley. 1995. Immunocytochemical localization of trkA receptors in chemically identified subgroups of adult rat sensory neurons. Eur. J. Neurosci. 7:1484–1494. - PMC - PubMed
    1. Bouchard, R., R. Pattarini, and J.D. Geiger. 2003. Presence and functional significance of presynaptic ryanodine receptors. Prog. Neurobiol. 69:391–418. - PubMed
    1. Brummendorf, T., and F.G. Rathjen. 1994. Cell adhesion molecules. 1: immunoglobulin superfamily. Protein Profile. 1:951–1058. - PubMed

Publication types

MeSH terms