. 2005 Sep 19;202(6):751-60.
doi: 10.1084/jem.20050811.

The structure of human CD23 and its interactions with IgE and CD21

Affiliations

The structure of human CD23 and its interactions with IgE and CD21

Richard G Hibbert et al. J Exp Med. .

Abstract

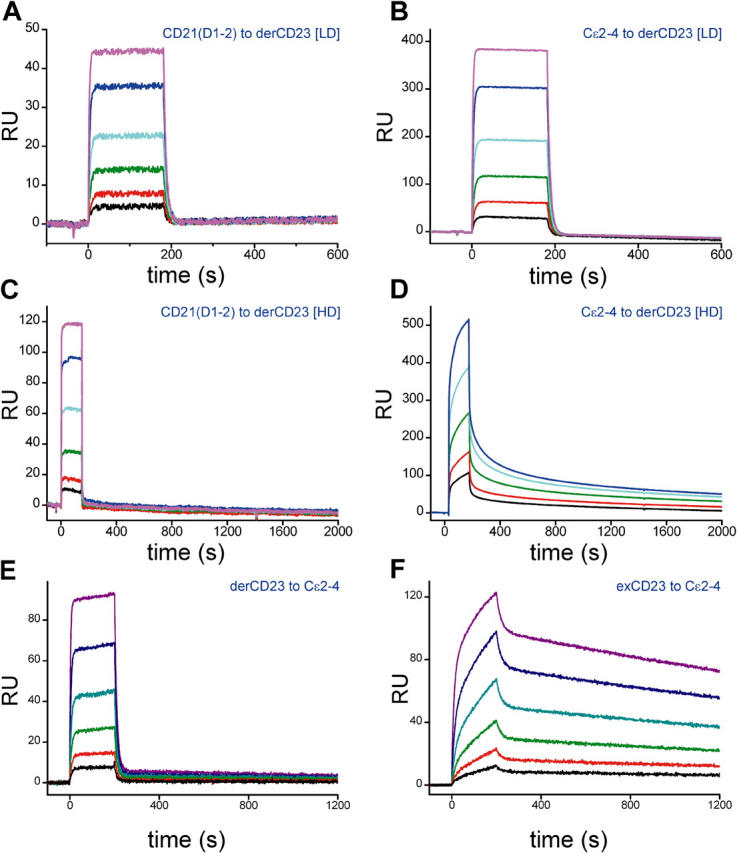
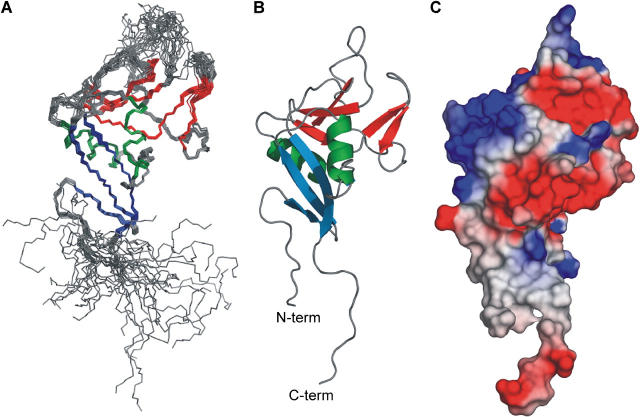
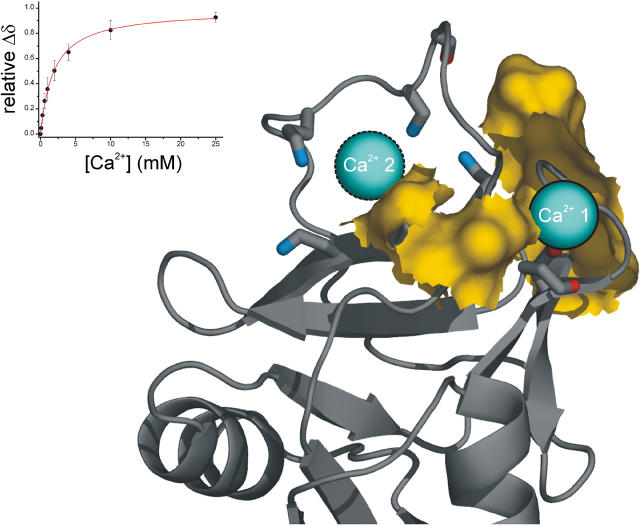
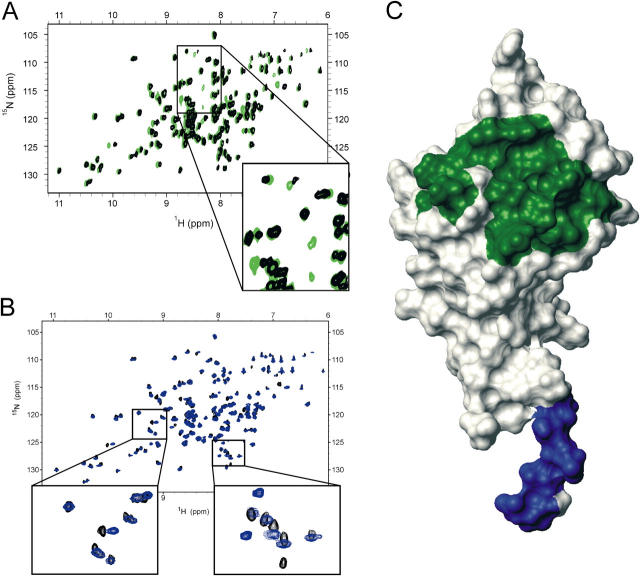
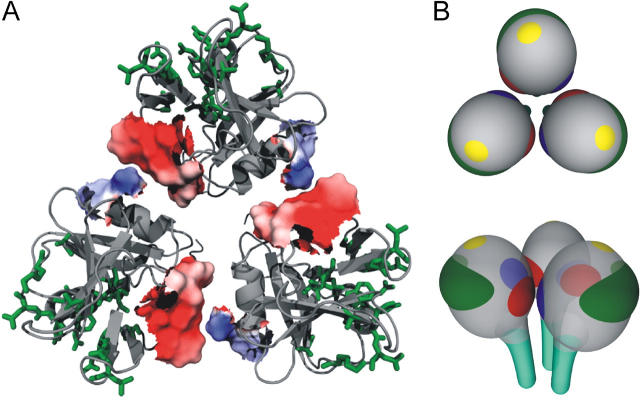
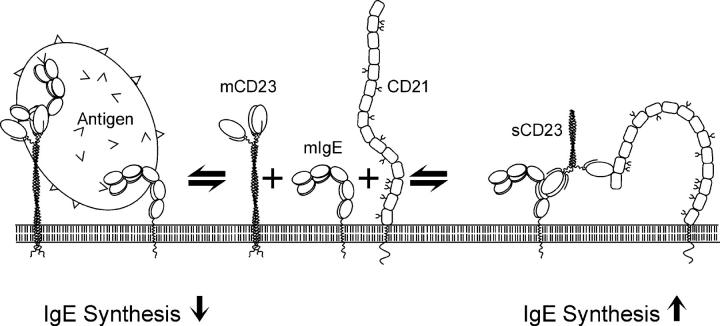
The low-affinity immunoglobulin E (IgE) receptor, CD23 (FcepsilonRII), binds both IgE and CD21 and, through these interactions, regulates the synthesis of IgE, the antibody isotype that mediates the allergic response. We have determined the three-dimensional structure of the C-type lectin domain of CD23 in solution by nuclear magnetic resonance spectroscopy. An analysis of concentration-dependent chemical shift perturbations have allowed us to identify the residues engaged in self-association to the trimeric state, whereas ligand-induced changes have defined the binding sites for IgE and CD21. The results further reveal that CD23 can bind both ligands simultaneously. Despite the C-type lectin domain structure, none of the interactions require calcium. We also find that IgE and CD23 can interact to form high molecular mass multimeric complexes. The interactions that we have described provide a solution to the paradox that CD23 is involved in both up- and down-regulation of IgE and provide a structural basis for the development of inhibitors of allergic disease.


Figures

Figure 1.
Figure 1.
Surface plasmon resonance analysis of CD23 interactions with CD21 and IgE. The binding of CD21(D1-2) (A and C) and IgE Cɛ2-4 (B and D) to immobilized derCD23 was determined over a range of ligand concentrations: 62.5 (black), 125 (red), 250 (green), 500 (cyan), 1,000 (blue), and 2,000 nM (purple). Binding to CD23 was tested at a low ligand density (LD; panels A and B) and at a high ligand density (HD; panels C and D). The reverse orientation, binding derCD23 and exCD23 to immobilized Cɛ2-4 (E and F), was also characterized for the same concentration range. Representative sensorgrams are shown here. The KD value for the monomeric interactions between derCD23 and CD21(D1-2) (A and C) is 8.7 ± 0.9 × 10⁻⁷ M and for derCD23 to Cɛ2-4 (B and E) is 1.3 ± 0.3 × 10⁻⁶ M. The interaction between exCD23 and Cɛ2-4 (F) shows a distinct biphasicity, with two binding constants of 1.1 ± 0.2 × 10⁻⁶ and 3.9 ± 0.6 × 10⁻⁸ M. The interaction between Cɛ2-4 and the high-density derCD23 surface (D) show complex kinetics that indicate several distinct binding events. It is markedly different from the interaction with the low density derCD23 surface (B), showing much slower dissociation rates.
Figure 2.
Figure 2.
The structure of derCD23. (A) View of the backbone (N, Cα, C′) of 20 superimposed NMR-derived structures of derCD23. (B) A ribbon diagram of the lowest energy conformer of derCD23, with secondary structural elements identified. (C) A surface representation of derCD23 colored according to electrostatic potential and coded such that regions with a potential <−4 kBT are red, whereas those >4 kBT are blue. kB, Boltzmann constant; T, absolute temperature.
Figure 3.
Figure 3.
The calcium binding site on CD23. The backbone cartoon of CD23 is shown in gray and the canonical CTLD calcium ions are indicated with blue spheres. Conserved potential chelating atoms are indicated and are colored red for site 1 and blue for site 2. Residues that show large changes in chemical shift (ΔδHN ≥ 0.08 ppm) on the addition of calcium are mapped onto the protein surface and are indicated in yellow. The inset shows the binding isotherm based on change in chemical shift position; results and standard deviations (KD of 1.80 ± 0.15 mM) are from the seven residues that show proton chemical shift changes of ≥0.08 ppm. These results suggest the occupancy of Ca2+ site 1 only.
Figure 4.
Figure 4.
1H-15N chemical shift perturbation experiments define the interaction surfaces on derCD23 for Cɛ3 and CD21(D1-2). A small number of residues show chemical shift perturbation on addition of IgE Cɛ3 or CD21(D1-2). Example spectra illustrating this are shown in (A) and (B), respectively. Insets show expanded views of the indicated areas. (C) Residues that show substantial chemical shift changes are mapped onto the derCD23 surface and are colored green for Cɛ3 and blue for CD21(D1-2). The orientation of this molecule is identical to that shown in Fig. 2.
Figure 5.
Figure 5.
The CD23 trimer and the architecture of ligand interaction sites. (A) An overhead view of the postulated CD23 trimer is shown. For each monomer, a backbone ribbon cartoon is shown in gray, and residues that show concentration-dependent chemical shift changes are displayed in a surface representation. The surfaces are colored according to electrostatic charge, demonstrating the electrostatic complementarity of the two sites. Side chains for residues that are part of the IgE interaction site are displayed and colored in green. (B) Cartoon representations (top and side views) illustrating the overall architecture of the trimer and the ligand binding sites. The two oligomerization sites are colored blue and red, respectively, the IgE interaction site is green, the CD21 binding site is cyan, and the calcium binding site is yellow. The front two molecules of the trimer are semitransparent.
Figure 6.
Figure 6.
Competition between CD23 and CD21 for membrane IgE on the B cell surface. (left) Co-cross-linking of membrane CD23 and membrane IgE by an allergen–IgE complex leads to down-regulation of IgE synthesis. (right) Trimeric soluble CD23 co-cross-linking of membrane IgE and CD21 leads to up-regulation. IgE binding to membrane CD23 also protects the latter against proteolysis and prevents formation of soluble CD23.

References

    1. Gould, H.J., R.L. Beavil, R. Reljic, J. Shi, C.W. Ma, B.J. Sutton, and R. Ghirlando. 1997. IgE homeostasis: is CD23 the safety switch? IgE Regulation: Molecular Mechanisms. D. Vercelli, editor. John Wiley & Sons Inc., New York. 35–59.
    1. Aubry, J.P., S. Pochon, P. Graber, K.U. Jansen, and J.Y. Bonnefoy. 1992. CD21 is a ligand for CD23 and regulates IgE production. Nature. 358:505–507. - PubMed
    1. Soilleux, E.J., R. Barten, and J. Trowsdale. 2000. DC-SIGN; a related gene, DC-SIGNR; and CD23 form a cluster on 19p13. J. Immunol. 165:2937–2942. - PubMed
    1. Mossalayi, M.D., M. Arock, G. Delespesse, H. Hofstetter, B. Bettler, A.H. Dalloul, E. Kilchherr, F. Quaaz, P. Debre, and M. Sarfati. 1992. Cytokine effects of CD23 are mediated by an epitope distinct from the IgE binding site. EMBO J. 11:4323–4328. - PMC - PubMed
    1. Shi, J., R. Ghirlando, R.L. Beavil, A.J. Beavil, M.B. Keown, R.J. Young, R.J. Owens, B.J. Sutton, and H.J. Gould. 1997. Interaction of the low-affinity receptor CD23/Fc epsilonRII lectin domain with the Fc epsilon3-4 fragment of human immunoglobulin E. Biochemistry. 36:2112–2122. - PubMed

Publication types