. 2005 Sep 27;102(39):13885-90.
doi: 10.1073/pnas.0505129102. Epub 2005 Sep 19.

Identification of slow correlated motions in proteins using residual dipolar and hydrogen-bond scalar couplings

Affiliations

Identification of slow correlated motions in proteins using residual dipolar and hydrogen-bond scalar couplings

Guillaume Bouvignies et al. Proc Natl Acad Sci U S A. .

Abstract

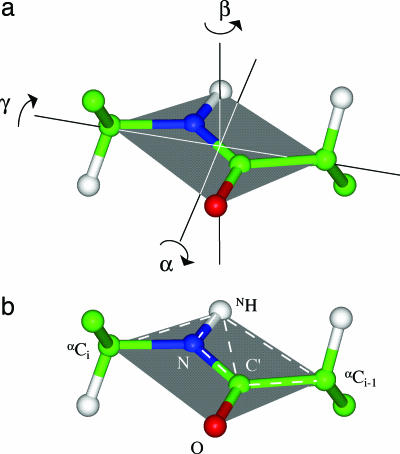
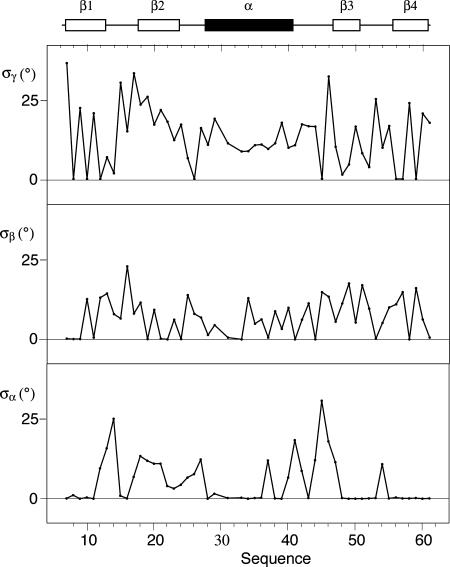
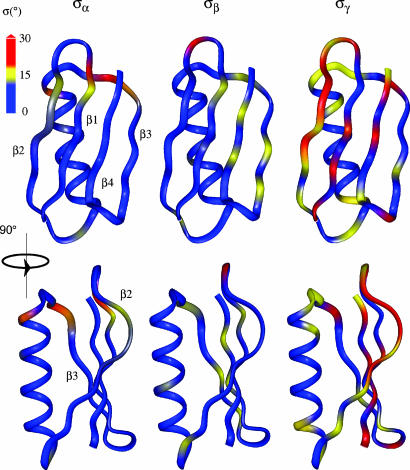
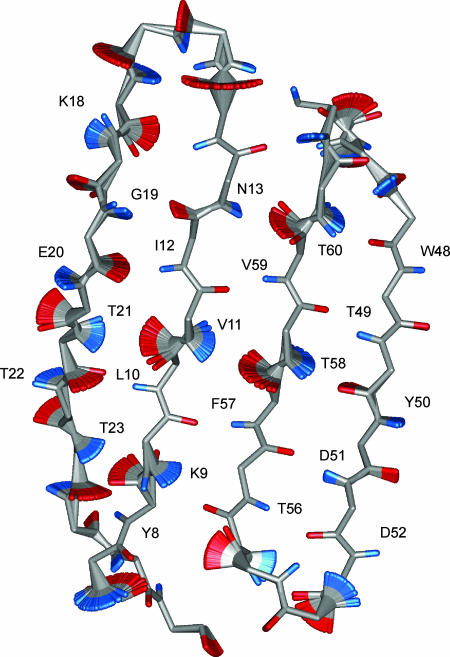
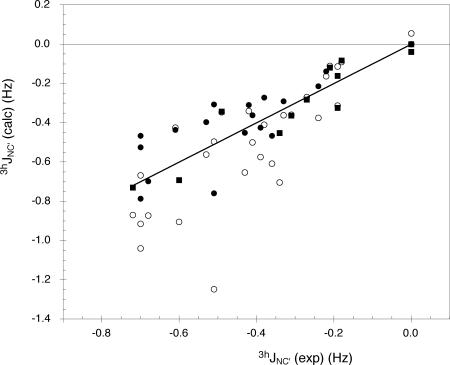
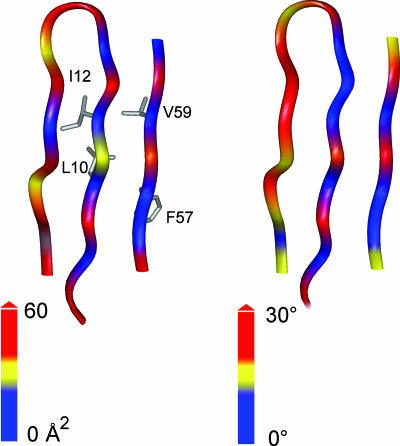
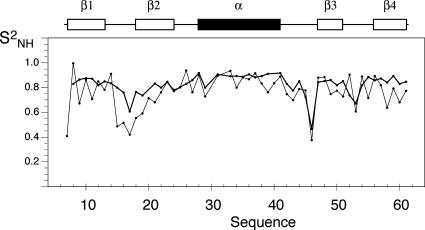
Despite their importance for biological activity, slower molecular motions beyond the nanosecond range remain poorly understood. We have assembled an unprecedented set of experimental NMR data, comprising up to 27 residual dipolar couplings per amino acid, to define the nature and amplitude of backbone motion in protein G using the Gaussian axial fluctuation model in three dimensions. Slower motions occur in the loops, and in the beta-sheet, and are absent in other regions of the molecule, including the alpha-helix. In the beta-sheet an alternating pattern of dynamics along the peptide sequence is found to form a long-range network of slow motion in the form of a standing wave extending across the beta-sheet, resulting in maximal conformational sampling at the interaction site. The alternating nodes along the sequence match the alternation of strongly hydrophobic side chains buried in the protein core. Confirmation of the motion is provided through extensive cross-validation and by independent hydrogen-bond scalar coupling analysis that shows this motion to be correlated. These observations strongly suggest that dynamical information can be transmitted across hydrogen bonds and have important implications for understanding collective motions and long-range information transfer in proteins.


Figures

Fig. 1.
Fig. 1.
A 3D GAF motional model. (a) Definition of the orientation of the 3D-GAF axes with respect to the peptide plane. In the text, γ-motions refers to rotational motions about the γ-axis and similarly for α- and β-motion. The γ-axis links the two Cα atoms; the α-axis is perpendicular to this axis in the peptide plane, and the β-axis is perpendicular to these two axes. (b) Depiction of the RDCs (1DHN, 2DC′H, 2DCαH, 2DHCα(i–1), 1DC′N, and 1DCαC′) that have been used to model the dynamics of the peptide plane in this work.
Fig. 2.
Fig. 2.
Motional amplitudes extracted from the 3D GAF analysis of backbone RDCs in protein G. The three plots show the α-, β-, and γ-motional amplitudes along the primary sequence. α-Motions are virtually undetectable in the secondary structural elements, whereas γ-motions tend to dominate throughout. Over the entire molecule, the χ2 drops from 504 to 330 when the 3D GAF model is used, corresponding to a probability that the improvement is due to chance of P < 10–10. Monte Carlo simulations were performed to estimate uncertainty in these parameters, resulting in the determination of an average error bar of ±5.4°, ±3.9°, and ±5.1° for amplitudes σα, σβ, and σγ respectively. The position of the β-strands are shown by open rectangles, and the α-helix is represented by a filled rectangle.
Fig. 3.
Fig. 3.
Distribution of motional amplitudes extracted from the 3D GAF analysis of backbone RDCs in protein G. Ribbon representations shown are taken from two different orientations, showing the amplitude of the 3D GAF motion shown in Fig. 2 with respect to tertiary fold (blue, 0–12°; yellow, 12–18°; red, ≥18°). Note that the γ- and β-motions appear to alternate across the β-sheet. The helix shows little variation along the sequence, with very small α-motions, and higher γ-motions at the termini.
Fig. 4.
Fig. 4.
Visualization of the distribution of γ motions in the β-sheet. GAF distributions of γ-motions are represented as conformational ensembles at each peptide plane, created by repeatedly rotating the static structure about the formula image axis through angles selected from a Gaussian distribution whose width is given by the experimentally determined amplitude of the γ-motion, σγ, given in Fig. 2. Only the peptide plane atoms (Cα, HN, N, C′, and O) are shown. The HN and O atoms are colored blue and red, respectively.
Fig. 5.
Fig. 5.
Analysis of scalar coupling across hydrogen bonds. Comparison of 3hJC′N HBCs calculated by using the static crystal structure (open circles) and a conformational average calculated over 10,000 conformers defined by the 3D GAF distributions (filled symbols) using equation 12 in ref. is shown. The same formula was used to calculate all hydrogen bonds from the geometry of randomly selected pairs from Gaussian distributions with amplitudes (σα, σβ, and σγ) centered on the crystal structure coordinates. The total χ2 between calculated and experimental HBCs for the 17 hydrogen bonds in the β-sheet falls from 0.92 Hz2 for the static model to 0.47 Hz2 for anticorrelated motions, 0.39 Hz2 for uncorrelated motions, and 0.27 Hz2 for correlated motions. For the α-helix, although improvement is found using the dynamic model compared with the static model (χ2 falls from 0.17 to 0.06 Hz2 for 10 sites), no further improvement is found when correlated effects are included. The straight line represents a slope of one, passing through zero. HBCs calculated from the β-sheet, using a correlated motional model, are shown as filled circles, and the remaining hydrogen bonds, including those from the α-helix, assuming no correlation, are shown as filled squares.
Fig. 6.
Fig. 6.
Comparison of surface accessibility calculated for the amino acids in β-strands 1, 2, and 4 compared with the amplitude of γ-motions. (Left) Ribbon representation of β-strands 1, 2, and 4 colored to show the amino acid side-chain surface accessibility calculated using the program naccess (43). (Scale from 0 to 60 Å2.) (Right) Ribbon representation of β-strands 1, 2, and 4 colored to show the amplitude of the γ-motion (σγ). (Scale from 0 to 30°.)
Fig. 7.
Fig. 7.
Comparison of “fast” and “fast and slow” generalized order parameters. The figure shows the relaxation-derived NH order parameter (bold line, from ref. 39) and the order parameter for the NH vector derived from the 3D GAF model (thin line). The β-sheet is shown by open rectangles, and the α-helix is shown by a filled rectangle.

Similar articles

Cited by

References

    1. Frauenfelder, H., Sligar, S. G. & Wolynes, P. G. (1991) Science 254, 1598–1603. - PubMed
    1. Karplus, M. & Kuriyan, J. (2005) Proc. Natl. Acad. Sci. USA 9, 646–652.
    1. Eisenmesser, E. Z., Bosco, D. A., Akke, M. & Kern, D. (2002) Science 295, 1520–1523. - PubMed
    1. Benkovic, S. J. & Hammes-Schiffer, S. (2003) Science 301, 1196–1202. - PubMed
    1. Baker, D. & Sali, A. (2001) Science 294, 93–96. - PubMed

Publication types

MeSH terms