

Electrochemical imaging of fusion pore openings by electrochemical detector arrays
- PMID: 16172395
- PMCID: PMC1236545
- DOI: 10.1073/pnas.0504098102
Electrochemical imaging of fusion pore openings by electrochemical detector arrays
Abstract
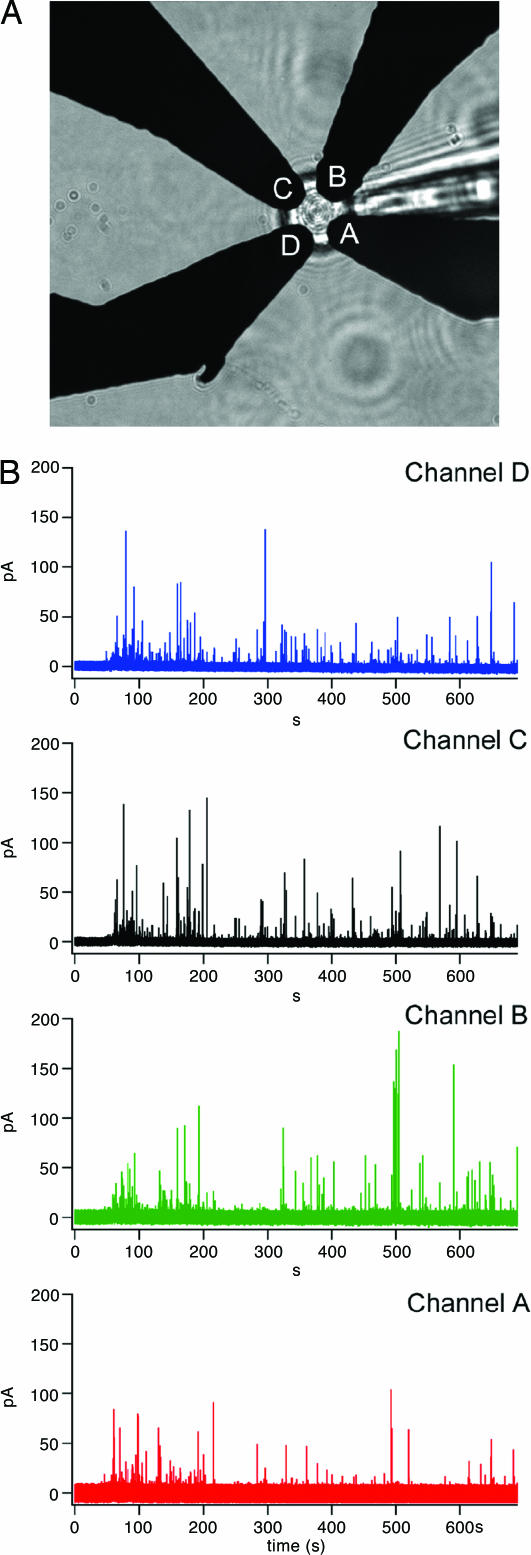
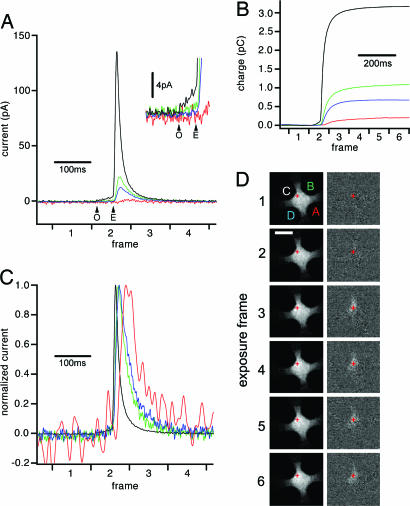
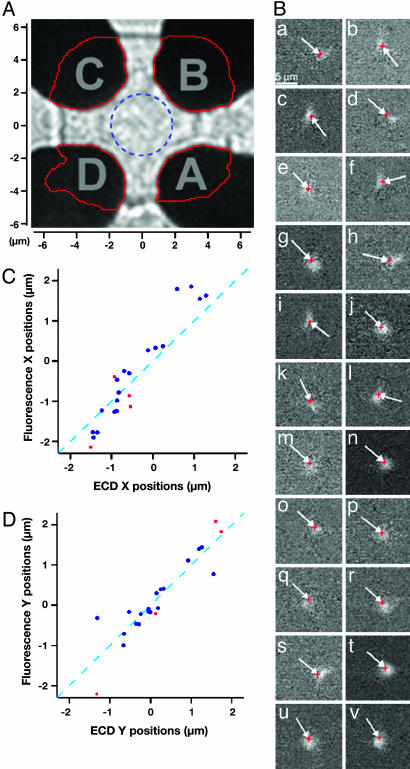
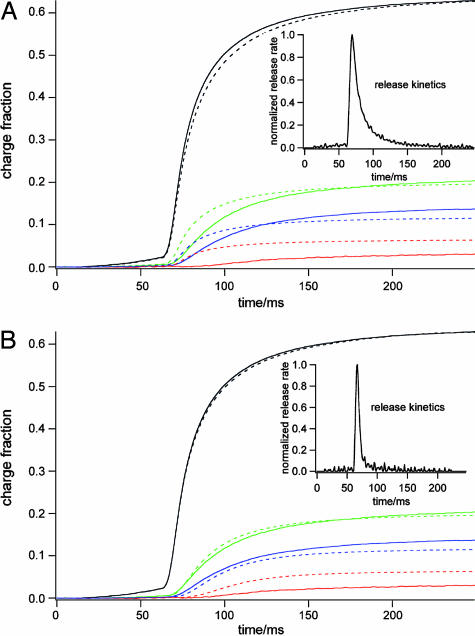
Opening of individual exocytotic fusion pores in chromaffin cells was imaged electrochemically with high time resolution. Electrochemical detector arrays that consist of four platinum microelectrodes were microfabricated on a glass coverslip. Exocytosis of single vesicles containing catecholamines from a cell positioned on top of the array is detected by the individual electrodes as a time-resolved oxidation current, reflecting the time course of arrival of catecholamine molecules at the electrode surfaces. The signals exhibit low noise and reveal foot signals indicating fusion pore formation and expansion. The position of individual release events is determined from the fraction of catecholamines recorded by the individual electrodes. Simultaneous fluorescence imaging of release of acridine orange from individual vesicles confirmed the electrochemical position assignments. This electrochemical camera provides very high time resolution, spatiotemporal localization of individual fusion pore openings and quantitative data on the flux of transmitter from individual vesicles. Analysis of the amperometric currents employing random walk simulations indicates that the time course of amperometric spikes measured near the cell surface is due to a low apparent diffusion coefficient of catecholamines near the cell surface and not due to slow dissociation from the granular matrix.
Figures
Similar articles
-
Improved surface-patterned platinum microelectrodes for the study of exocytotic events.Anal Chem. 2009 Nov 1;81(21):8734-40. doi: 10.1021/ac900674g. Anal Chem. 2009. PMID: 19780579 Free PMC article.
-
The exocytotic event in chromaffin cells revealed by patch amperometry.Nature. 1997 Oct 2;389(6650):509-12. doi: 10.1038/39081. Nature. 1997. PMID: 9333242
-
Interplay between membrane dynamics, diffusion and swelling pressure governs individual vesicular exocytotic events during release of adrenaline by chromaffin cells.Biochimie. 2000 May;82(5):481-96. doi: 10.1016/s0300-9084(00)00213-3. Biochimie. 2000. PMID: 10865134
-
The Patch Amperometry Technique: Design of a Method to Study Exocytosis of Single Vesicles.In: Michael AC, Borland LM, editors. Electrochemical Methods for Neuroscience. Boca Raton (FL): CRC Press/Taylor & Francis; 2007. Chapter 15. In: Michael AC, Borland LM, editors. Electrochemical Methods for Neuroscience. Boca Raton (FL): CRC Press/Taylor & Francis; 2007. Chapter 15. PMID: 21204378 Free Books & Documents. Review.
-
Relationship between amperometric pre-spike feet and secretion granule composition in chromaffin cells: an overview.Biophys Chem. 2007 Sep;129(2-3):181-9. doi: 10.1016/j.bpc.2007.05.018. Epub 2007 Jun 6. Biophys Chem. 2007. PMID: 17587484 Review.
Cited by
-
Influence of quantal size and cAMP on the kinetics of quantal catecholamine release from rat chromaffin cells.Biophys J. 2007 Apr 15;92(8):2735-46. doi: 10.1529/biophysj.106.088997. Epub 2007 Jan 19. Biophys J. 2007. PMID: 17237205 Free PMC article.
-
Intravesicular factors controlling exocytosis in chromaffin cells.Cell Mol Neurobiol. 2010 Nov;30(8):1359-64. doi: 10.1007/s10571-010-9589-6. Epub 2010 Nov 3. Cell Mol Neurobiol. 2010. PMID: 21046452 Free PMC article.
-
Exocytotic catecholamine release is not associated with cation flux through channels in the vesicle membrane but Na+ influx through the fusion pore.Nat Cell Biol. 2007 Aug;9(8):915-22. doi: 10.1038/ncb1617. Epub 2007 Jul 22. Nat Cell Biol. 2007. PMID: 17643118 Free PMC article.
-
Development and characterization of a diamond-insulated graphitic multi electrode array realized with ion beam lithography.Sensors (Basel). 2014 Dec 30;15(1):515-28. doi: 10.3390/s150100515. Sensors (Basel). 2014. PMID: 25558992 Free PMC article.
-
Two approaches for addressing electrochemical electrode arrays with reduced external connections.Anal Methods. 2015 Jul 21;7(14):5760-5766. doi: 10.1039/C5AY00229J. Epub 2015 Jun 22. Anal Methods. 2015. PMID: 27293487 Free PMC article.
References
-
- Almers, W. (1990) Ann. Rev. Physiol. 52, 607–624. - PubMed
-
- Lindau, M. & Alvarez de Toledo, G. (2003) Biochim. Biophys. Acta 1641, 167–173. - PubMed
-
- Albillos, A., Dernick, G., Horstmann, H., Almers, W., Alvarez de Toledo, G. & Lindau, M. (1997) Nature 389, 509–512. - PubMed
-
- Alés, E., Tabares, L., Poyato, J. M., Valero, V., Lindau, M. & Alvarez de Toledo, G. (1999) Nat. Cell Biol. 1, 40–44. - PubMed
-
- Dernick, G., Alvarez De Toledo, G. & Lindau, M. (2003) Nat. Cell Biol. 5, 358–362. - PubMed
Publication types
MeSH terms
Substances
Grants and funding
LinkOut - more resources
Full Text Sources
Other Literature Sources
