

Fine mapping and physical characterization of two linked quantitative trait loci affecting milk fat yield in dairy cattle on BTA26
- PMID: 16172504
- PMCID: PMC1456170
- DOI: 10.1534/genetics.105.046169
Fine mapping and physical characterization of two linked quantitative trait loci affecting milk fat yield in dairy cattle on BTA26
Abstract
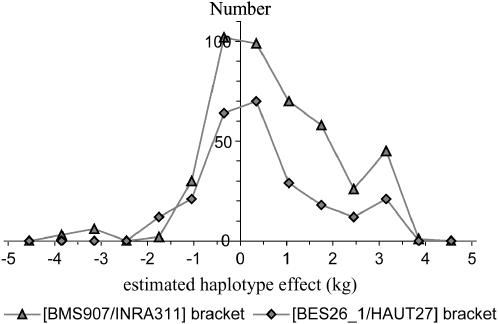
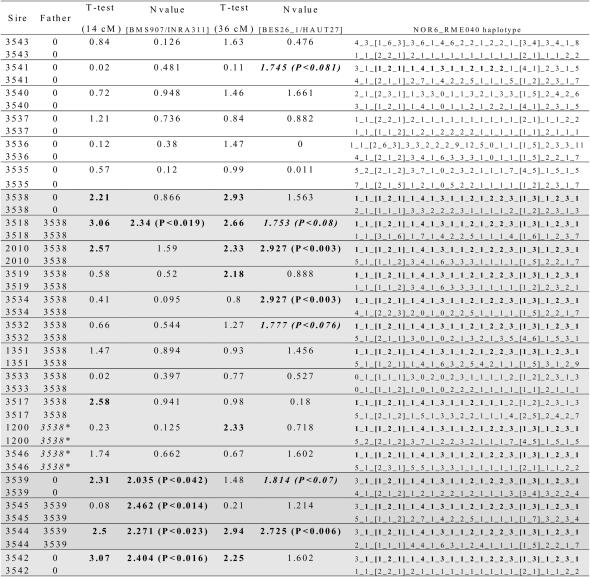
Previously, a highly significant QTL affecting fat yield and protein yield and mapped to the bovine BTA26 chromosome has been reported to segregate in the French Holstein cattle population. To confirm and refine the location of this QTL, the original detection experiment was extended by adding 12 new families and genotyping 25 additional microsatellite markers (including 11 newly developed markers). Data were then analyzed by an approach combining both linkage and linkage disequilibrium information, making it possible to identify two linked QTL separated by 20 cM corresponding to approximately 29 Mb. The presence of a QTL affecting protein yield was confirmed but its position was found to be more telomeric than the two QTLunderlying fat yield. Each identified QTL affecting milk fat yield was physically mapped within a segment estimated to be <500 kb. Two strong functional candidate genes involved, respectively, in fatty acid metabolism and membrane permeability were found to be localized within this segment while other functional candidate genes were discarded. A haplotype comprising the favorable allele at each QTL position appears to be overrepresented in the artificial insemination bull population.
Figures


Similar articles
-
Detection of quantitative trait loci affecting milk production, health, and reproductive traits in Holstein cattle.J Dairy Sci. 2004 Feb;87(2):468-75. doi: 10.3168/jds.S0022-0302(04)73186-0. J Dairy Sci. 2004. PMID: 14762090
-
Fine mapping of milk production QTL on BTA6 by combined linkage and linkage disequilibrium analysis.J Dairy Sci. 2004 Mar;87(3):690-8. doi: 10.3168/jds.S0022-0302(04)73212-9. J Dairy Sci. 2004. PMID: 15202654
-
Detection of quantitative trait loci affecting milk production traits on 10 chromosomes in Holstein cattle.J Dairy Sci. 2001 Jun;84(6):1516-24. doi: 10.3168/jds.S0022-0302(01)70185-3. J Dairy Sci. 2001. PMID: 11417712
-
Novel linkage mapping approach using DNA pooling in human and animal genetics. II. Detection of quantitative traits loci in dairy cattle.J Appl Genet. 2002;43(3):309-18. J Appl Genet. 2002. PMID: 12177520 Review.
-
Quantitative trait loci mapping in dairy cattle: review and meta-analysis.Genet Sel Evol. 2004 Mar-Apr;36(2):163-90. doi: 10.1186/1297-9686-36-2-163. Genet Sel Evol. 2004. PMID: 15040897 Free PMC article. Review.
Cited by
-
Genetic effects of stearoyl-coenzyme A desaturase (SCD) polymorphism on milk production traits in the Chinese dairy population.Mol Biol Rep. 2012 Sep;39(9):8733-40. doi: 10.1007/s11033-012-1733-6. Epub 2012 Jun 22. Mol Biol Rep. 2012. PMID: 22722989
-
Mapping genes for complex traits in domestic animals and their use in breeding programmes.Nat Rev Genet. 2009 Jun;10(6):381-91. doi: 10.1038/nrg2575. Nat Rev Genet. 2009. PMID: 19448663 Review.
-
Identification of Single Nucleotide Polymorphism Marker and Association Analysis of Marbling Score in Fas Gene of Hanwoo.Asian-Australas J Anim Sci. 2016 Jan;29(1):23-8. doi: 10.5713/ajas.14.0812. Asian-Australas J Anim Sci. 2016. PMID: 26732324 Free PMC article.
-
Variation in the stearoyl-CoA desaturase gene (SCD) and its influence on milk fatty acid composition in late-lactation dairy cattle grazed on pasture.Arch Anim Breed. 2020 Nov 3;63(2):355-366. doi: 10.5194/aab-63-355-2020. eCollection 2020. Arch Anim Breed. 2020. PMID: 33178884 Free PMC article.
-
Genome wide CNV analysis reveals additional variants associated with milk production traits in Holsteins.BMC Genomics. 2014 Aug 15;15(1):683. doi: 10.1186/1471-2164-15-683. BMC Genomics. 2014. PMID: 25128478 Free PMC article.
References
-
- Andersson, L., and M. Georges, 2004. Domestic-animal genomics: deciphering the genetics of complex traits. Nat. Rev. Genet. 5: 202–212. - PubMed
-
- Barendse, W., D. Vaiman, S. J. Kemp, Y. Sugimoto, S. M. Armitage et al., 1997. A medium-density genetic linkage map of the bovine genome. Mamm. Genome 8: 21–28. - PubMed
Publication types
MeSH terms
Substances
LinkOut - more resources
Full Text Sources
Other Literature Sources
Miscellaneous
