

Fidelity discrimination in DNA polymerase beta: differing closing profiles for a mismatched (G:A) versus matched (G:C) base pair
- PMID: 16173754
- PMCID: PMC2625286
- DOI: 10.1021/ja052623o
Fidelity discrimination in DNA polymerase beta: differing closing profiles for a mismatched (G:A) versus matched (G:C) base pair
Abstract
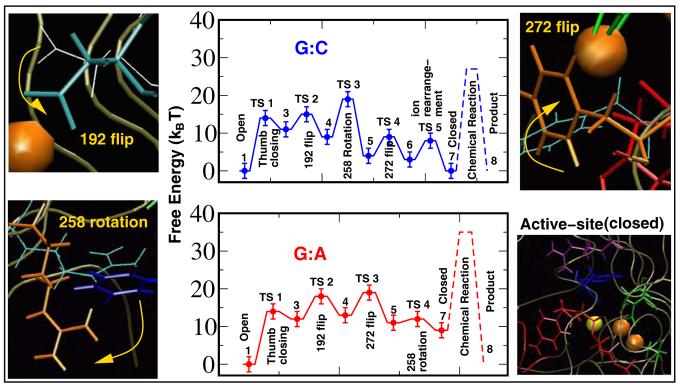
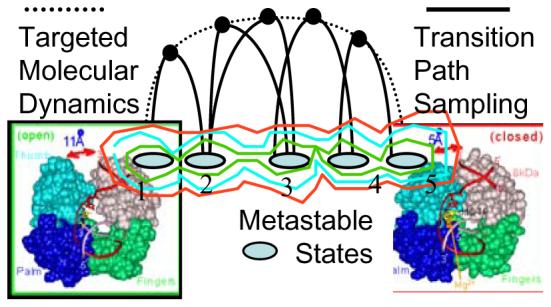
Understanding fidelity-the faithful replication or repair of DNA by polymerases-requires tracking of the structural and energetic changes involved, including the elusive transient intermediates, for nucleotide incorporation at the template/primer DNA junction. We report, using path sampling simulations and a reaction network model, strikingly different transition states in DNA polymerase beta's conformational closing for correct dCTP versus incorrect dATP incoming nucleotide opposite a template G. The cascade of transition states leads to differing active-site assembly processes toward the "two-metal-ion catalysis" geometry. We demonstrate that these context-specific pathways imply different selection processes: while active-site assembly occurs more rapidly with the correct nucleotide and leads to primer extension, the enzyme remains open longer, has a more transient closed state, and forms product more slowly when an incorrect nucleotide is present. Our results also suggest that the rate-limiting step in pol beta's conformational closing is not identical to that for overall nucleotide insertion and that the rate-limiting step in the overall nucleotide incorporation process for matched as well as mismatched systems occurs after the closing conformational change.
Figures
Similar articles
-
Mismatch-induced conformational distortions in polymerase beta support an induced-fit mechanism for fidelity.Biochemistry. 2005 Oct 11;44(40):13328-41. doi: 10.1021/bi0507682. Biochemistry. 2005. PMID: 16201758
-
Differing conformational pathways before and after chemistry for insertion of dATP versus dCTP opposite 8-oxoG in DNA polymerase beta.Biophys J. 2007 May 1;92(9):3063-70. doi: 10.1529/biophysj.106.092106. Epub 2007 Feb 9. Biophys J. 2007. PMID: 17293403 Free PMC article.
-
Mismatched base-pair simulations for ASFV Pol X/DNA complexes help interpret frequent G*G misincorporation.J Mol Biol. 2008 Dec 31;384(5):1086-97. doi: 10.1016/j.jmb.2008.10.025. Epub 2008 Oct 17. J Mol Biol. 2008. PMID: 18955064 Free PMC article.
-
Regulation of DNA repair fidelity by molecular checkpoints: "gates" in DNA polymerase beta's substrate selection.Biochemistry. 2006 Dec 26;45(51):15142-56. doi: 10.1021/bi061353z. Epub 2006 Dec 1. Biochemistry. 2006. PMID: 17176036 Free PMC article. Review.
-
Biochemical basis of DNA replication fidelity.Crit Rev Biochem Mol Biol. 1993;28(2):83-126. doi: 10.3109/10409239309086792. Crit Rev Biochem Mol Biol. 1993. PMID: 8485987 Review.
Cited by
-
Relationship between conformational changes in pol lambda's active site upon binding incorrect nucleotides and mismatch incorporation rates.J Phys Chem B. 2009 Oct 1;113(39):13035-47. doi: 10.1021/jp903172x. J Phys Chem B. 2009. PMID: 19572669 Free PMC article.
-
Sequential side-chain residue motions transform the binary into the ternary state of DNA polymerase lambda.Biophys J. 2006 Nov 1;91(9):3182-95. doi: 10.1529/biophysj.106.092080. Epub 2006 Aug 18. Biophys J. 2006. PMID: 16920835 Free PMC article.
-
Insights into the high fidelity of a DNA polymerase I mutant.J Mol Model. 2009 Oct;15(10):1271-80. doi: 10.1007/s00894-009-0491-4. Epub 2009 Mar 31. J Mol Model. 2009. PMID: 19333629
-
"Gate-keeper" residues and active-site rearrangements in DNA polymerase μ help discriminate non-cognate nucleotides.PLoS Comput Biol. 2013;9(5):e1003074. doi: 10.1371/journal.pcbi.1003074. Epub 2013 May 23. PLoS Comput Biol. 2013. PMID: 23717197 Free PMC article.
-
Substrate recognition by norovirus polymerase: microsecond molecular dynamics study.J Comput Aided Mol Des. 2013 Apr;27(4):373-88. doi: 10.1007/s10822-013-9652-8. Epub 2013 Apr 26. J Comput Aided Mol Des. 2013. PMID: 23619980
References
-
- Friedberg EC. Nature. 2003;421:436–439. - PubMed
-
- Sawaya MR, Prasad R, Wilson SH, Kraut J, Pelletier H. Biochemistry. 1997;36:11205–11215. - PubMed
-
- Vande Berg BJ, Beard WA, Wilson SH. J. Biol. Chem. 2001;276:3408–3416. - PubMed
-
- Shah AM, Li S-X, Anderson KS, Sweasy JB. J. Biol. Chem. 2001;276:10824–10831. - PubMed
Publication types
MeSH terms
Substances
Grants and funding
LinkOut - more resources
Full Text Sources
