

Automated identification of axonal growth cones in time-lapse image sequences
- PMID: 16174535
- PMCID: PMC3848907
- DOI: 10.1016/j.jneumeth.2005.07.010
Automated identification of axonal growth cones in time-lapse image sequences
Abstract
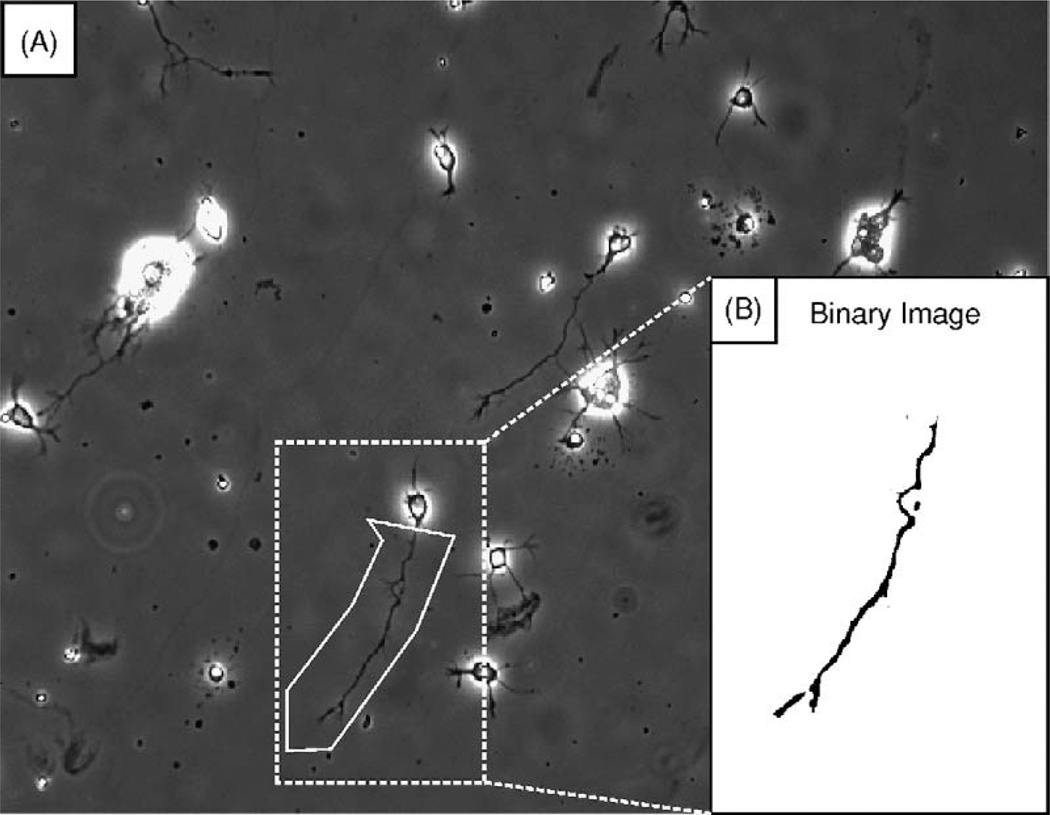
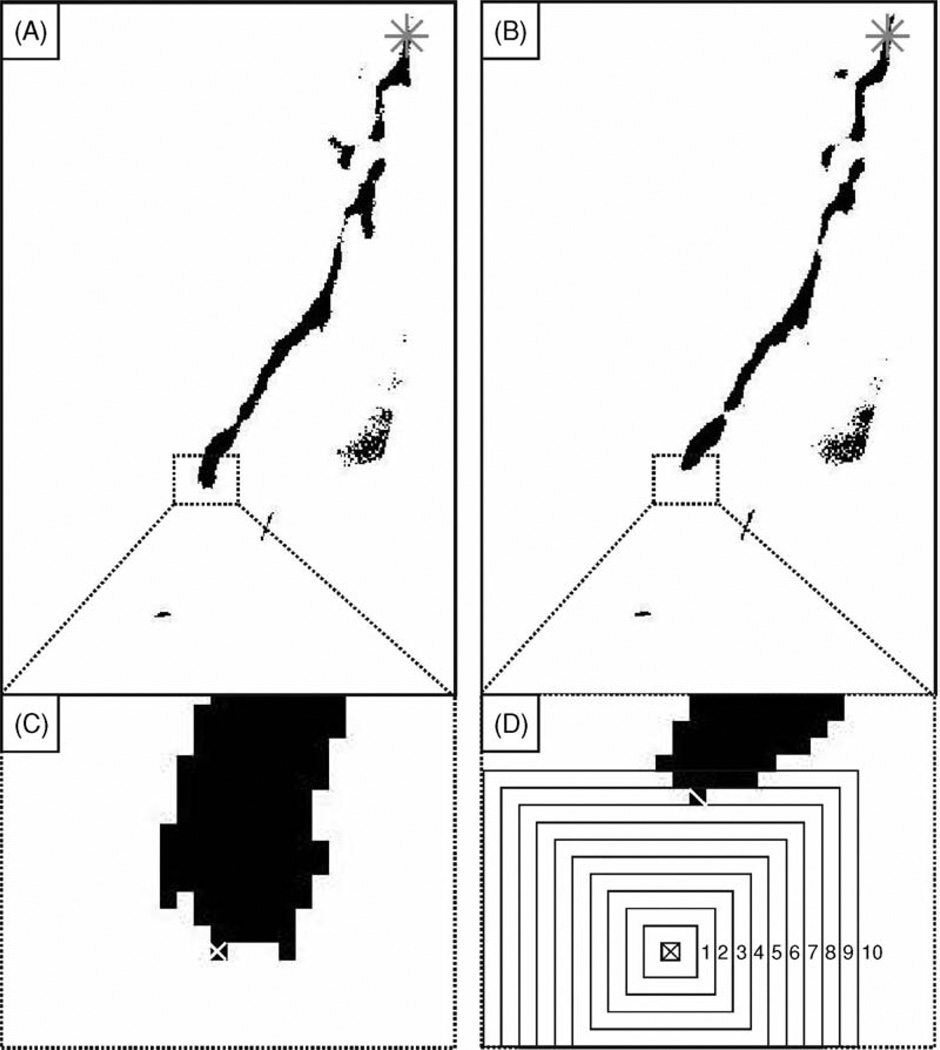
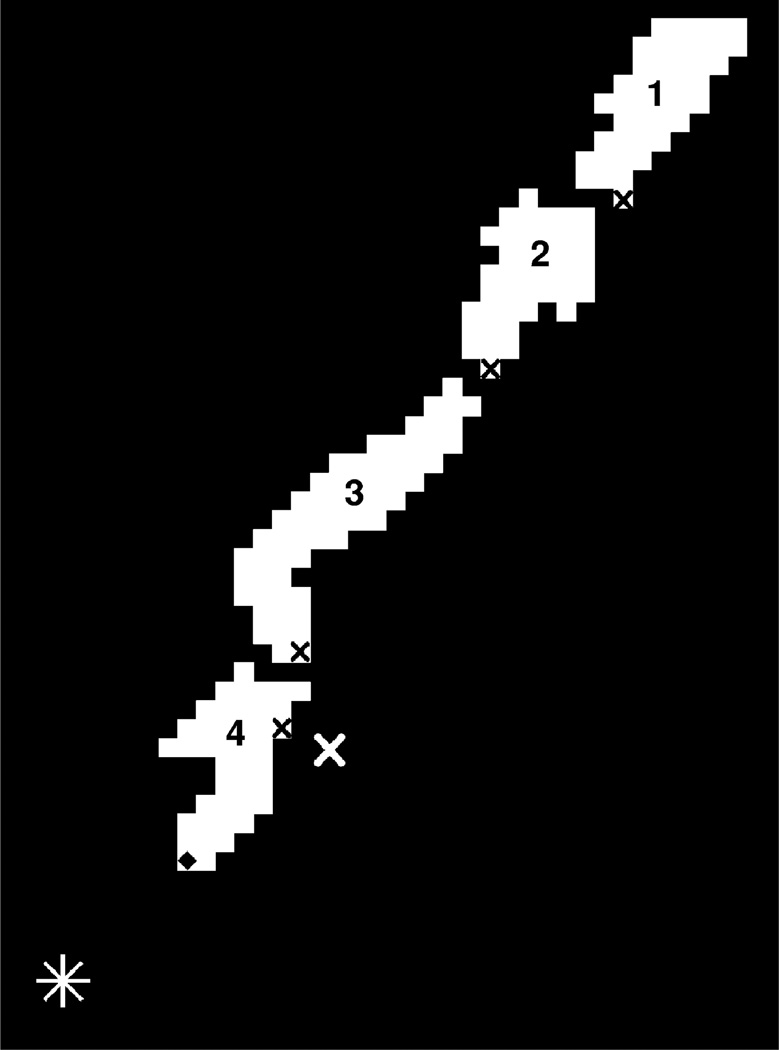
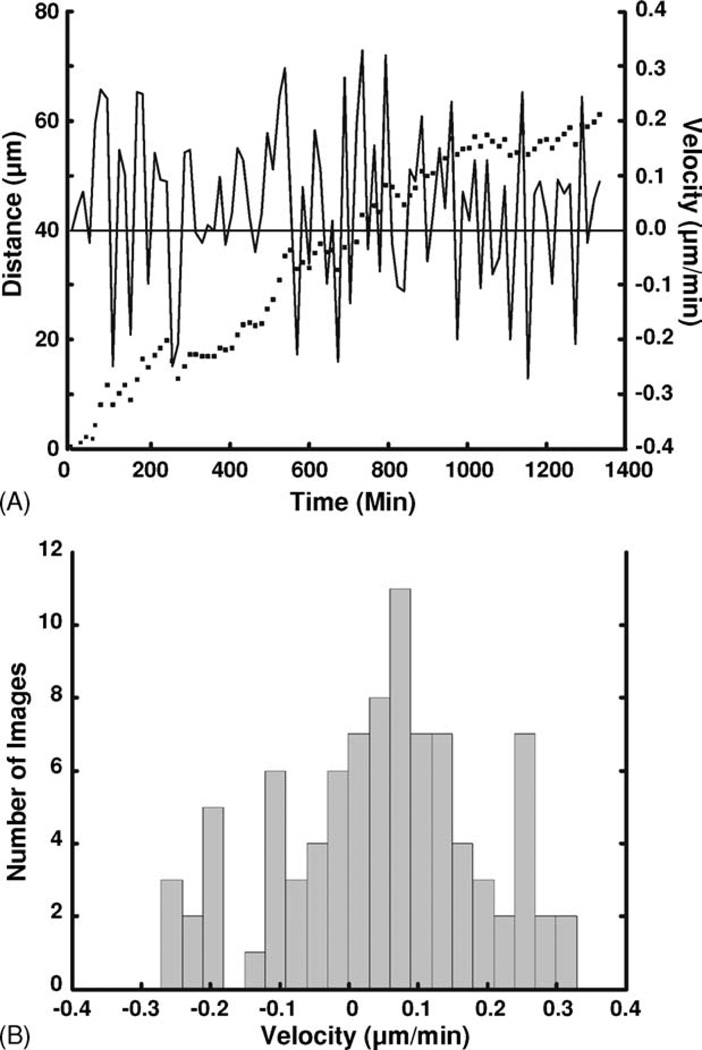
The isolation and purification of axon guidance molecules has enabled in vitro studies of the effects of axon guidance molecule gradients on numerous neuronal cell types. In a typical experiment, cultured neurons are exposed to a chemotactic gradient and their growth is recorded by manual identification of the axon tip position from two or more micrographs. Detailed and statistically valid quantification of axon growth requires evaluation of a large number of neurons at closely spaced time points (e.g. using a time-lapse microscopy setup). However, manual tracing becomes increasingly impractical for recording axon growth as the number of time points and/or neurons increases. We present a software tool that automatically identifies and records the axon tip position in each phase-contrast image of a time-lapse series with minimal user involvement. The software outputs several quantitative measures of axon growth, and allows users to develop custom measurements. For, example analysis of growth velocity for a dissociated E13 mouse cortical neuron revealed frequent extension and retraction events with an average growth velocity of 0.05 +/- 0.14 microm/min. Comparison of software-identified axon tip positions with manually identified axon tip positions shows that the software's performance is indistinguishable from that of skilled human users.
Figures
Similar articles
-
A method for semiautomatic tracing and morphological measuring of neurite outgrowth from DIC sequences.Annu Int Conf IEEE Eng Med Biol Soc. 2008;2008:1196-9. doi: 10.1109/IEMBS.2008.4649377. Annu Int Conf IEEE Eng Med Biol Soc. 2008. PMID: 19162880
-
Automated semantic analysis of changes in image sequences of neurons in culture.IEEE Trans Biomed Eng. 2006 Jun;53(6):1109-23. doi: 10.1109/TBME.2006.873565. IEEE Trans Biomed Eng. 2006. PMID: 16761838
-
A semi-Markov model for mitosis segmentation in time-lapse phase contrast microscopy image sequences of stem cell populations.IEEE Trans Med Imaging. 2012 Feb;31(2):359-69. doi: 10.1109/TMI.2011.2169495. Epub 2011 Sep 26. IEEE Trans Med Imaging. 2012. PMID: 21954199
-
Common mechanisms underlying growth cone guidance and axon branching.J Neurobiol. 2000 Aug;44(2):145-58. J Neurobiol. 2000. PMID: 10934318 Review.
-
From whole organism to ultrastructure: progress in axonal imaging for decoding circuit development.Development. 2021 Sep 15;148(18):dev199717. doi: 10.1242/dev.199717. Epub 2021 Jul 30. Development. 2021. PMID: 34328171 Free PMC article. Review.
Cited by
-
High-content neurite development study using optically patterned substrates.PLoS One. 2012;7(4):e35911. doi: 10.1371/journal.pone.0035911. Epub 2012 Apr 26. PLoS One. 2012. PMID: 22563416 Free PMC article.
-
Dendrite and Axon Specific Geometrical Transformation in Neurite Development.Front Comput Neurosci. 2016 Jan 28;9:156. doi: 10.3389/fncom.2015.00156. eCollection 2015. Front Comput Neurosci. 2016. PMID: 26858635 Free PMC article.
-
NeuroRhythmics: software for analyzing time-series measurements of saltatory movements in neuronal processes.J Neurosci Methods. 2008 Aug 15;173(1):147-52. doi: 10.1016/j.jneumeth.2008.05.006. Epub 2008 May 17. J Neurosci Methods. 2008. PMID: 18572249 Free PMC article.
-
Label-free detection of neuronal differentiation in cell populations using high-throughput live-cell imaging of PC12 cells.PLoS One. 2013;8(2):e56690. doi: 10.1371/journal.pone.0056690. Epub 2013 Feb 22. PLoS One. 2013. PMID: 23451069 Free PMC article.
-
An Automated Strategy for Unbiased Morphometric Analyses and Classifications of Growth Cones In Vitro.PLoS One. 2015 Oct 23;10(10):e0140959. doi: 10.1371/journal.pone.0140959. eCollection 2015. PLoS One. 2015. PMID: 26496644 Free PMC article.
References
-
- Azzara A, Chimenti M, Azzarelli L, Fanini E, Carulli G, Ambrogi F. An image processing workstation for automatic evaluation of human granulocyte motility. J Immunol Meth. 1992;148:29–40. - PubMed
-
- Bilsland J, Rigby M, Young L, Harper S. A rapid method for semi-quantitative analysis of neurite outgrowth from chick DRG explants using image analysis. J Neurosci Meth. 1999;92:75–85. - PubMed
-
- Cheung AT, Donovan RM, Miller ME, Bettendorff AJ, Goldstein E. Quantitative microscopy. I. A computer-assisted approach to the study of polymorphonuclear leukocyte (PMN) chemotaxis. J Leukoc Biol. 1987;41:481–491. - PubMed
-
- Distasi C, Ariano P, Zamburlin P, Ferraro M. In vitro analysis of neuron-glial cell interactions during cellular migration. Eur Biophys J. 2002;31:81–88. - PubMed
-
- Donovan RM, Goldstein E, Kim Y, Lippert W, Cheung AT, Miller ME. A quantitative method for the analysis of cell shape and locomotion. Histochemistry. 1986;84:525–529. - PubMed
Publication types
MeSH terms
Grants and funding
LinkOut - more resources
Full Text Sources
