. 2005 Sep 27;102(39):13903-8.
doi: 10.1073/pnas.0506017102. Epub 2005 Sep 20.

Microtubule movements on the arms of mitotic chromosomes: polar ejection forces quantified in vitro

Affiliations

Microtubule movements on the arms of mitotic chromosomes: polar ejection forces quantified in vitro

Gary J Brouhard et al. Proc Natl Acad Sci U S A. .

Abstract

During mitosis, "polar ejection forces" (PEFs) are hypothesized to direct prometaphase chromosome movements by pushing chromosome arms toward the spindle equator. PEFs are postulated to be caused by (i) plus-end-directed microtubule (MT)-based motor proteins on the chromosome arms, namely chromokinesins, and (ii) the polymerization of spindle MTs into the chromosome. However, the exact role of PEFs is unclear, because little is known about their magnitude or their forms (e.g., impulsive vs. sustained, etc.). In this study, we employ optical tweezers to bring about the lateral interaction between chromosome arms and MTs in vitro to directly measure the speed and force of the PEFs developed on chromosome arms. We find that forces are unidirectional and frequently exceed 1 pN, with maximum forces of 2-3 pN and peak velocities of 63 +/- 41 nm/s; the movements are ATP-dependent and exhibit a characteristic noncontinuous motion that includes displacements of >50 nm, stalls, and backwards slippage of the MT even under low loads. We perform experiments using antibodies to the chromokinesins Kid and KIF4 that identify Kid as the principal force-producing agent for PEFs. At first glance, this motor activity appears surprisingly weak and erratic, but it explains how PEFs can guide chromosome movements without severely deforming or damaging the local chromosome structure.


Figures

Fig. 1.
Fig. 1.
Measurement of polar ejection forces in vitro. (1 and 2) Motility assay schematic, showing all components, with both bottom view (1) and side view (2). In the bottom view, the schematic is inverted, as the CHO chromosomes are adhered to the upper surface of a flow chamber. The MTs are attached to silica beads by means of a biotin-streptavidin linkage, namely, biotinylated MTs are attached to streptavidin-coated silica beads, which are manipulated with the optical trap. Shown are sister chromatid arms (A), the centromere region (B), and the location of the kinetochore (C, not depicted). The side view shows the flow chamber and the laser beam (D), the objective lens (E), and the condenser lens (F). (3) Differential interference contrast (DIC) micrograph of a bead and chromosome during an experiment. (4) Video-enhanced image of the same experiment reveals a microtubule spanning from the bead across the chromosome.
Fig. 2.
Fig. 2.
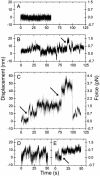
Force and displacement signals from single MT–chromosome interactions. All traces are positions of the bead in the trap. (A) Baseline signal from a MT–chromosome interaction in the absence of ATP. (BE) Interactions from four separate chromosomes; arrows indicate maximal velocity movements.
Fig. 3.
Fig. 3.
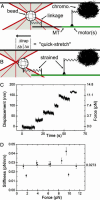
Experiments to measure series compliances in the assay system. (A and B) Schematic of the assay indicating locations of series compliances. The quick-stretch experiments, AB, introduce strain in these compliant elements, represented as stretched springs in B. The optical trap is displaced by Δtrap, and the silica bead moves out of the trap a distance, Δb, and the remainder Δx is attributed to stretching in the compliant elements. (C) Sixty-second QPD data stream taken during a quick-stretch experiment. The jumps in signal correspond to separate quick-stretch movements. (D) Plot of calculated stiffness values for different tensions. The stretching is divided by the median tension of the quick-stretch to determine each stiffness value. The line at κ = 0.0273 shows the average stiffness value used in the velocity analysis.

References

    1. Rieder, C. L. & Salmon, E. D. (1998) Trends Cell Biol. 8, 310–318. - PMC - PubMed
    1. Maddox, P., Straight, A., Coughlin, P., Mitchison, T. J. & Salmon, E. D. (2003) J. Cell Biol. 162, 377–382. - PMC - PubMed
    1. Hunt, A. J. & McIntosh, J. R. (1998) Mol. Biol. Cell 9, 2857–2871. - PMC - PubMed
    1. Rieder, C. L., Davison, E. A., Jensen, L. C., Cassimeris, L. & Salmon, E. D. (1986) J. Cell Biol. 103, 581–591. - PMC - PubMed
    1. Rieder, C. L. & Salmon, E. D. (1994) J. Cell Biol. 124, 223–233. - PMC - PubMed

Publication types