

Mirror-symmetry breaking in the Soai reaction: a kinetic understanding
- PMID: 16174731
- PMCID: PMC1236534
- DOI: 10.1073/pnas.0503171102
Mirror-symmetry breaking in the Soai reaction: a kinetic understanding
Abstract
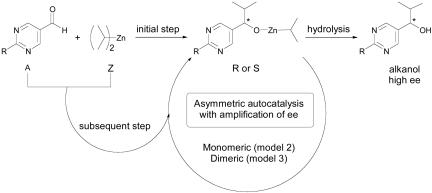
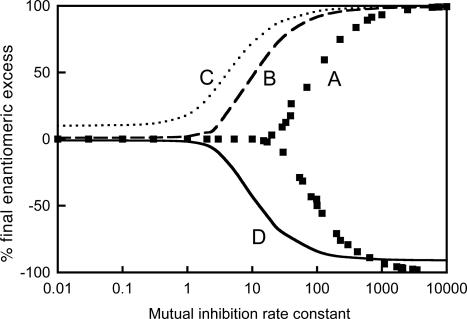
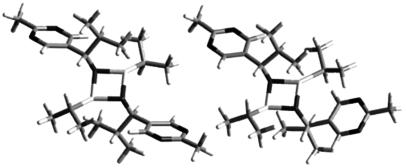
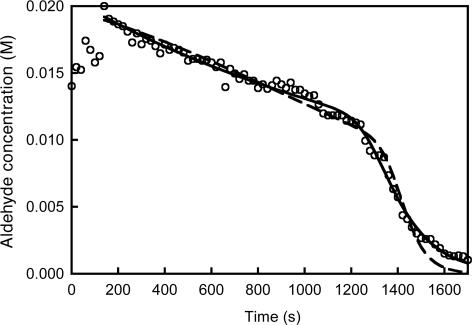
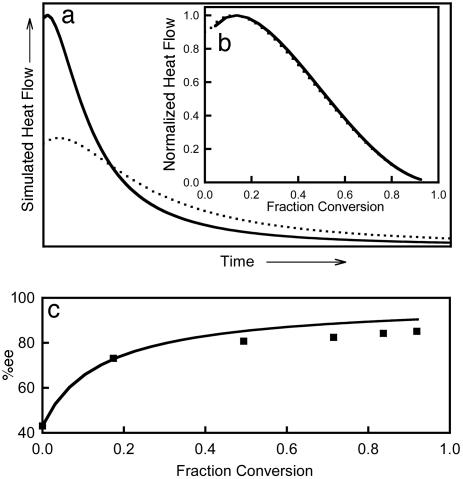
Kinetic modeling using nonlinear differential equations is proposed to analyze the spontaneous generation of enantiomeric excess in the autocatalytic addition of diisopropylzinc to prochiral pyrimidine carbaldehydes (Soai reaction). Our approach reproduces experimentally observed giant chiral amplification from an initial enantiomeric excess of <10(-6)% to >60%, high sensitivity and positive response to the presence of minute amounts of chiral initiator at concentrations <10(-14) M, and spontaneous absolute asymmetric synthesis from achiral starting conditions. From our numerical simulations using kinetic schemes derived from the Frank model, including stereospecific autocatalysis and mutual inhibition, we have shown that it is possible to reproduce the mirror-symmetry-breaking behavior of the Soai reaction under batch conditions leading to a bimodal enantiomeric product distribution. Mirror-symmetry breaking was found to be resistant to a loss of stereoselectivity up to 30%. While the mutual inhibition between enantiomers seems to originate from the presence of dimerization equilibria, the exact nature of the autocatalytic stereoselective process still remains to be revealed. From the kinetic viewpoint, simple autocatalysis involving monomers as the catalytic species is consistent with all reported experimental effects of the Soai reaction.
Figures
 C–, or (CH3)3Si–CC–.
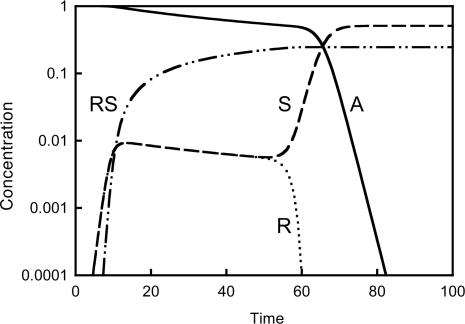
Similar articles
-
In Situ Mass Spectrometric and Kinetic Investigations of Soai's Asymmetric Autocatalysis.Chemistry. 2020 Dec 4;26(68):15871-15880. doi: 10.1002/chem.202003260. Epub 2020 Oct 15. Chemistry. 2020. PMID: 32822103 Free PMC article.
-
Oscillatory symmetry breaking in the Soai reaction.J Phys Chem B. 2008 Jul 31;112(30):9196-200. doi: 10.1021/jp803334b. Epub 2008 Jul 2. J Phys Chem B. 2008. PMID: 18593153
-
Amplification of enantiomeric excess, mirror-image symmetry breaking and kinetic proofreading in Soai reaction models with different oligomeric orders.Phys Chem Chem Phys. 2012 Oct 14;14(38):13239-48. doi: 10.1039/c2cp42041d. Phys Chem Chem Phys. 2012. PMID: 22914796
-
Asymmetric autocatalysis. Chiral symmetry breaking and the origins of homochirality of organic molecules.Proc Jpn Acad Ser B Phys Biol Sci. 2019;95(3):89-110. doi: 10.2183/pjab.95.009. Proc Jpn Acad Ser B Phys Biol Sci. 2019. PMID: 30853700 Free PMC article. Review.
-
Asymmetric Autocatalysis as an Efficient Link Between the Origin of Homochirality and Highly Enantioenriched Compounds.Orig Life Evol Biosph. 2022 Sep;52(1-3):57-74. doi: 10.1007/s11084-022-09626-7. Epub 2022 Aug 12. Orig Life Evol Biosph. 2022. PMID: 35960427 Review.
Cited by
-
Crystal Structure of the Isopropylzinc Alkoxide of Pyrimidyl Alkanol: Mechanistic Insights for Asymmetric Autocatalysis with Amplification of Enantiomeric Excess.Angew Chem Int Ed Engl. 2015 Dec 7;54(50):15218-21. doi: 10.1002/anie.201508036. Epub 2015 Oct 23. Angew Chem Int Ed Engl. 2015. PMID: 26494200 Free PMC article.
-
In Situ Mass Spectrometric and Kinetic Investigations of Soai's Asymmetric Autocatalysis.Chemistry. 2020 Dec 4;26(68):15871-15880. doi: 10.1002/chem.202003260. Epub 2020 Oct 15. Chemistry. 2020. PMID: 32822103 Free PMC article.
-
Stochastic and empirical models of the absolute asymmetric synthesis by the Soai-autocatalysis.J Mol Model. 2015 Feb;21(2):33. doi: 10.1007/s00894-015-2576-6. Epub 2015 Feb 3. J Mol Model. 2015. PMID: 25644371
-
The Role of Templating in the Emergence of RNA from the Prebiotic Chemical Mixture.Life (Basel). 2017 Oct 31;7(4):41. doi: 10.3390/life7040041. Life (Basel). 2017. PMID: 29088116 Free PMC article.
-
A synthetic molecular system capable of mirror-image genetic replication and transcription.Nat Chem. 2016 Jul;8(7):698-704. doi: 10.1038/nchem.2517. Epub 2016 May 16. Nat Chem. 2016. PMID: 27325097
References
-
- Mislow, K. (2003) Coll. Czech. Chem. Commun. 68, 849–864.
-
- Feringa, B. L. & van Delden, R. A. (1999) Angew. Chem. Int. Ed. 38, 3418–3438. - PubMed
-
- Tissot, O., Gouygou, M., Dallemer, F., Daran, J.-C. & Balavoine, G. G. A. (2001) Angew. Chem. Int. Ed. 40, 1076–1078. - PubMed
-
- Avalos, M., Babiano, R., Cintas, P., Jiménez, J. L., Palacios, J. C. & Barron, L. D. (1998) Chem. Rev. 98, 2391–2404. - PubMed
-
- Ribó, J. M., Crusats, J., Sagués, F., Claret, J. & Rubires, R. (2001) Science 292, 2063–2066. - PubMed
LinkOut - more resources
Full Text Sources
Molecular Biology Databases
