. 2005 Sep 20;102(38):13586-91.
doi: 10.1073/pnas.0504268102. Epub 2005 Sep 7.

Intrathymic administration of hematopoietic progenitor cells enhances T cell reconstitution in ZAP-70 severe combined immunodeficiency

Affiliations

Intrathymic administration of hematopoietic progenitor cells enhances T cell reconstitution in ZAP-70 severe combined immunodeficiency

Oumeya Adjali et al. Proc Natl Acad Sci U S A. .

Abstract

Patients with severe combined immunodeficiency (SCID) present with opportunistic infections that are almost universally fatal in infancy. The mainstay treatment for these patients is allogeneic hematopoietic stem cell (HSC) transplantation, but sustained polyclonal T cell reconstitution is too often unsatisfactory. Although transplantation is conventionally performed by i.v. administration of HSC, we hypothesized that an intrathymic strategy would be superior. Indeed, several progenitor cell populations are incapable of homing to the thymus, the major site of T cell differentiation, and it appears that there are extensive time periods during which the thymus is refractory to progenitor cell import. To test this hypothesis, nonconditioned infant ZAP-70-deficient SCID mice were intrathymically injected with WT bone marrow progenitor cells, a procedure accomplished without surgical intervention. Upon intrathymic HSC injection, there was a more rapid T cell differentiation, with mature thymocytes detected by 4 weeks after transplantation. Intrathymic injection of HSC also resulted in significantly higher numbers of peripheral T cells, increased percentages of naïve T cells, and more diverse T cell receptor repertoires. Moreover, T cell reconstitution after intrathymic transplantation was obtained after injection of 10-fold fewer donor HSC. Thus, this intrathymic transplantation approach may improve the outcome of SCID patients by enhancing T cell reconstitution.


Figures
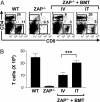
Fig. 1.
Fig. 1.
T cell reconstitution in ZAP-70-/- mice after i.v. and IT administration of WT BM progenitor cells. (A) ZAP-/- mice were injected with lin-WT BM progenitor cells (2-5 × 10⁵ per mouse) by either i.v. or IT routes (BMT). The presence of splenic T cells was monitored at 13 weeks after BMT by using PE-conjugated α-CD8 and Cy-conjugated α-CD4 antibodies. The percentages of CD8+ and CD4+ T cells from these representative WT, ZAP-70-/-, and reconstituted mice are indicated. (B) Bar graph quantification of CD3+ T cells in ZAP-70-/- mice injected with WT HSC at 3 weeks of age. Results are presented as means ± SD (n = 4). ***, P = 0.0008.
Fig. 2.
Fig. 2.
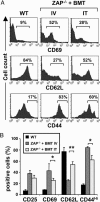
T cell phenotype in ZAP-70-deficient mice reconstituted by i.v. and IT administration of WT BM progenitor cells. ZAP-/- mice were injected i.v. or IT with WT lin-BM cells (2 × 10⁵ cells) at 3 weeks of age. Lymph node cells were analyzed at 14 weeks after BMT. (A) The phenotype of CD3+ T cells was determined by using α-CD69, α-CD62L, and α-CD44 antibodies. (B) Bar graph quantification of CD3+ T cells positive for CD25, CD69, CD62L, and CD44 markers are presented as means ± SD (n = 3 for all groups). *, P ≤ 0.05; **, P ≤ 0.01.
Fig. 3.
Fig. 3.
Function and repertoire diversity of T cells differentiating after IT injection of WT BM progenitors. (A) Lymph nodes were recovered from WT mice as well as ZAP-/- mice reconstituted by either i.v. or IT administration of WT BM progenitor cells (2-5 × 10⁵ per mouse). Cells were labeled with the fluorescent dye 5-carboxyfluorescein diacetate succinimidyl ester (CFSE) and cultured in vitro in the absence (-) or presence of αCD3 and αCD28 antibodies (1 μg/ml). Three days after activation, CFSE intensity in T lymphocytes was assessed by flow cytometry. The numbers shown above the peaks indicate the number of cell divisions. (B) Bar graph quantification of TCR diversity profiles from 22 TCRBV families. Results are expressed as the percentages of nondetected, oligoclonal (≤4 peaks), polyclonal skewed (>4 peaks, shifted CDR3 distribution) or polyclonal (>4 peaks, Gaussian distribution) BV families from WT (n = 3), as well as i.v.-reconstituted (n = 7) and IT-reconstituted (n = 5) ZAP-/- mice. *, P ≤ 0.05; **, indicates P ≤ 0.01. (C) ZAP-/- mice were injected with lin-WT BM progenitors through i.v. or IT administration. At 12-14 weeks after transplantation, TCRBV repertoires were assessed in peripheral T cells by comparison of TCR CDR3 size distribution obtained after PCR amplification (Immunoscope profiles). Results of 13 representative BV families are shown as density peak histograms with fluorescence intensity in arbitrary units (y axis) plotted against CDR3 size (x axis).
Fig. 4.
Fig. 4.
Kinetics of thymocyte differentiation in ZAP-/- mice after i.v. and IT injection of WT BM progenitor cells. The percentages of SP CD4 and CD8 thymocytes in WT and ZAP-/- mice are shown. Thymocytes were harvested from euthanized ZAP-/--injected mice at different time points after i.v. or IT administration of WT BM cells. At 4, 8, and 13 weeks after BMT, the percentages of SP CD4 and CD8 thymocytes were assessed (n = 3-11 per group).
Fig. 5.
Fig. 5.
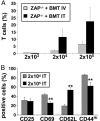
T cell reconstitution of ZAP-70-/- mice requires 10-fold fewer numbers of BM progenitor cells upon IT injection. (A) ZAP-/- mice received 2 × 10³, 2 × 10⁴, or 2 × 10⁵ WT lin- BM cells by i.v. or IT administration. Lymph node cells were harvested from euthanized animals at 14 weeks after BMT and the percentages of CD3+ T cells were monitored by cytometry. Results are presented as means ± SD (n = 3 per group). (B) Bar graph quantification of the percentages of CD3+ T cells expressing CD25, CD69, CD62L, and CD44 markers 14 weeks after IT injection of either 2 × 10⁴ or 2 × 10⁵ WT BM cells. Results are presented as means ± SD (n = 3 per group). **, indicates P ≤ 0.01.

References

    1. Antoine, C., Muller, S., Cant, A., Cavazzana-Calvo, M., Veys, P., Vossen, J., Fasth, A., Heilmann, C., Wulffraat, N., Seger, R., et al. (2003) Lancet 361, 553-560. - PubMed
    1. Buckley, R. H., Schiff, S. E., Schiff, R. I., Markert, L., Williams, L. W., Roberts, J. L., Myers, L. A. & Ward, F. E. (1999) N. Engl. J. Med. 340, 508-516. - PubMed
    1. Patel, D. D., Gooding, M. E., Parrott, R. E., Curtis, K. M., Haynes, B. F. & Buckley, R. H. (2000) N. Engl. J. Med. 342, 1325-1332. - PubMed
    1. Spangrude, G. J. & Weissman, I. L. (1988) J. Immunol. 141, 1877-1890. - PubMed
    1. Foss, D. L., Donskoy, E. & Goldschneider, I. (2001) J. Exp. Med. 193, 365-374. - PMC - PubMed

Publication types

MeSH terms