. 2006 Jan 15;107(2):610-8.
doi: 10.1182/blood-2005-06-2271. Epub 2005 Sep 20.

FcepsilonR1 and toll-like receptors mediate synergistic signals to markedly augment production of inflammatory cytokines in murine mast cells

Affiliations

FcepsilonR1 and toll-like receptors mediate synergistic signals to markedly augment production of inflammatory cytokines in murine mast cells

Huihong Qiao et al. Blood. .

Abstract

Mast cells mediate both IgE-dependent allergic reactions and protective responses against acute infections, possibly through the activation of Toll-like receptors (TLRs). We find that antigen interacts synergistically with TLR2 and TLR4 ligands to markedly enhance production of cytokines in murine mast cell lines. However, the TLR ligands neither stimulated degranulation and release of arachidonic acid nor influenced such responses to antigen, probably because these ligands failed to generate a necessary calcium signal. The enhanced cytokine production could be attributed to synergistic activation of mitogen-activated protein kinases in addition to the engagement of a more effective repertoire of transcription factors for cytokine gene transcription. The synergistic interactions of TLR ligands and antigen might have relevance to the exacerbation of IgE-mediated allergic diseases by infectious agents.


Figures

Figure 1.
Figure 1.
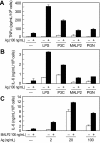
TLR ligands do not affect degranulation and release of [14C]arachidonic acid. IgE-primed MC/9 cells and BMMCs were exposed to vehicle (NS), antigen (Ag; 20 ng/mL), PGN (100 μg/mL), P3C (1 μg/mL), LPS (100 ng/mL), or MALP2 (100 μg/mL) (A-B) or with the indicated concentrations of Ag or P3C plus 1 μg/mL P3C (C) or 20 ng/mL Ag (D) for 20 minutes for measurement of released β-hexosaminidase. (C-F) Vehicle was substituted for antigen in the samples designated “0.” Virtually identical results were obtained with LPS (100 ng/mL), PGN (100 μg/mL), and MALP-2 (100 ng/mL) as those shown in panel C (data not shown). For measurement of production of [14C]arachidonic acid, cells were incubated with [14C]arachidonic acid (1 μCi/mL [0.037 MBq]) for 18 hours before stimulation with antigen in combination with P3C (1 μg/mL) for 20 minutes (E,F). Values are the mean ± SEM from 4 experiments and are expressed as percent release of intracellular β-hexosaminidase or as a percent of total intracellular [14C]lipids that were released into the medium as [14C]arachidonic acid.
Figure 2.
Figure 2.
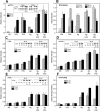
P3C and LPS act in synergy with antigen to markedly potentiate production of cytokines in MC/9 cells. IgE-primed MC/9 cells were stimulated in complete growth medium with the indicated concentrations of antigen (Ag), P3C, and LPS, individually or in the combinations indicated. Levels of TNFα (A-C), IL-6 (D), and IL-13 (E,F) were determined by ELISA 3 hours (A-E) or 6 hours (F) after addition of stimulants. Vehicle was substituted Ag (A,C,D,E, and F) or PC3 (B) where the concentration is designated as 0. Values are the mean ± SEM from 3 cultures. Asterisks indicate significant increase in response as compared to the responses to antigen (*P < .05; **P < .001). Identical results were obtained in 2 other experiments.
Figure 3.
Figure 3.
TLR ligands potentiate production of cytokines in BMMCs. IgE-primed cultures of BMMCs from C57BL/6 mice were incubated for 3 hours with vehicle (–), the indicated concentrations of antigen (Ag), 100 ng/mL LPS, 1 μg/mL P3C, 100 ng/mL MALP2, or 100 μg/mL PGN, individually or in combination. TNFα (A) and IL-6 (B, C) were determined by ELISA. A different source of C57BL/6 mice was used for the experiments shown in panel C. Values are the mean ± SEM from 3 cultures and are representative of 3 experiments.
Figure 4.
Figure 4.
TLR ligands do not generate calcium signals. IgE-primed MC/9 cells and BMMCs were loaded with Fura-2 and then stimulated or not (NS) with 20 ng/mL antigen (Ag), 1 μg/mL P3C, 100 ng/mL LPS, 100 ng/mL MALP2, or 10 μg/mL PGN, individually or in combination as indicated. Arrows indicate time of addition of stimulant(s). Values are expressed as the ratio of Fura-2 fluorescence at 510 nm when cells were excited alternately at 340 nm and 380 nm. The results are representative of 3 or more separate experiments.
Figure 5.
Figure 5.
Activation of protein kinases by TLR ligands and antigen and effects of MAP kinase inhibitors on TNFα production in MC/9 cells. IgE-primed MC/9 cells were stimulated or not (NS) for the periods indicated with 100 ng/mL LPS, 1 μg/mL P3C, and 20 ng/mL antigen (Ag), individually or in combination. (A) IRAK1 was immunoprecipitated and assayed for kinase activity by incubation with [γ-32/P]ATP and myelin basic protein (MBP). The product, 32P-labeled MBP, was separated and detected by electrophoresis and autoradiography. (B) Immunoblots were prepared also from cell extracts and then probed with antibodies that detected either the indicated activated phosphorylated protein kinase or the protein itself. The blots are representative of blots from at least 3 separate experiments. (C) The relative densities of the doubly phosphorylated (Thr183/Tyr185)–JNK band were determined by densitometry. The values are the mean ± SEM of 4 experiments that were terminated 15, 30, and 60 minutes after addition of ligand(s). (D) IgE-primed MC/9 cells were incubated with vehicle, 25 μM SP 600125, 10 μM SB 203580, or 30 μM PD 98059 for 1 hour before addition of 100 ng/mL LPS, 1 μg/mL P3C, and 20 ng/mL antigen, individually or in combination. TNFα was assayed by ELISA 3 hours thereafter. ND indicates not detectable. Values are mean ± SEM of 4 cultures and are from 1 of 2 identical experiments.
Figure 6.
Figure 6.
Activation of transcription factors by TLR ligands and antigen. IgE-primed MC/9 cells were stimulated or not (NS) for the periods indicated with 100 ng/mL LPS, 1 μg/mL P3C, and 20 ng/mL antigen (Ag), individually or in combination. Immunoblots were prepared from cell extracts and then probed for the indicated transcription factors or their activated phosphorylated forms with appropriate antibodies. Typical blots and their relative densities (mean ± SEM of values from 3 experiments) are shown for phosphorylated (Thr71)–ATF-2 (A), c-Jun (C), phosphorylated (Ser63)–c-Jun (D), and c-Fos (E). In addition, nuclear extracts were assayed for NF-κB (B) and c-Fos (F) oligonucleotide-binding activities by use of a commercial kit. The values are the mean ± SEM from 3 cultures. Identical results were obtained in a second experiment.
Figure 7.
Figure 7.
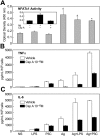
Activation of NF-AT by antigen and inhibitory effects of cyclosporine-A on NF-AT activation and production of cytokines. IgE-primed MC/9 cells were stimulated or not (NS) in complete growth medium for 30 minutes for measurement of NF-AT oligonucleotide-binding activity (A) or for 3 hours for measurement of TNFα (B) and IL-6 (C). Stimulants included 100 ng/mL LPS, 1 μg/mL P3C, and 20 ng/mL antigen (Ag), alone or in combination. Where indicated, cultures were incubated with 1 μM cyclosporine A (CsA) for 60 minutes before addition of stimulants. The values are the mean ± SEM of 3 cultures. Identical results were obtained in 2 other experiments.

References

    1. CDC US. Forecasted state-specific estimates of self reported asthma prevalence—United States. MMWR Morb Mortal Wkly Rep. 1998;47: 1022-1025. - PubMed
    1. Beaven MA, Hundley TR. Mast cell related diseases: genetics, signaling pathways, and novel therapies. In: Finkel TH, Gutkind JS, eds. Signal Transduction and Human Disease. Hoboken, NJ: John Wiley & Sons Inc; 2003: 307-355.
    1. Gern JE. Viral and bacterial infections in the development and progression of asthma. J Allergy Clin Immunol. 2000;105: S497-S502. - PubMed
    1. Tan WC. Viruses in asthma exacerbations. Curr Opin Pulm Med. 2005;11: 21-26. - PubMed
    1. Marsland BJ, Scanga CB, Kopf M, Le GG. Allergic airway inflammation is exacerbated during acute influenza infection and correlates with increased allergen presentation and recruitment of allergen-specific T-helper type 2 cells. Clin Exp Allergy. 2004;34: 1299-1306. - PubMed

Publication types

MeSH terms