. 2005 Nov;3(11):e351.
doi: 10.1371/journal.pbio.0030351. Epub 2005 Sep 27.

Temperature regulates transcription in the zebrafish circadian clock

Affiliations

Temperature regulates transcription in the zebrafish circadian clock

Kajori Lahiri et al. PLoS Biol. 2005 Nov.

Abstract

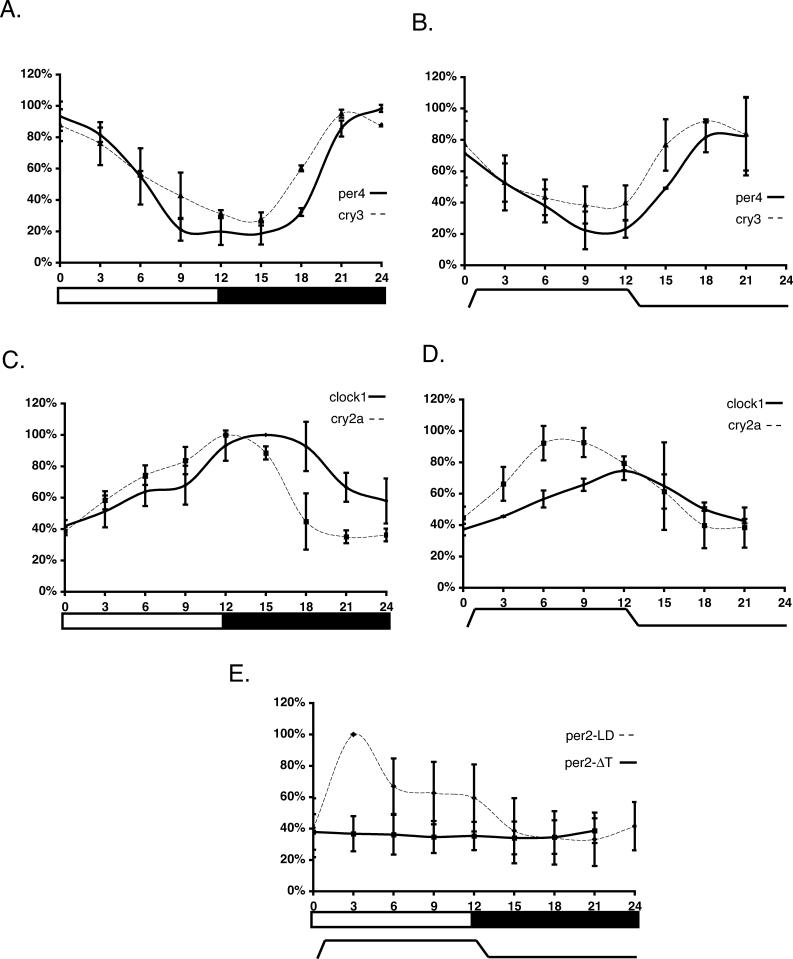
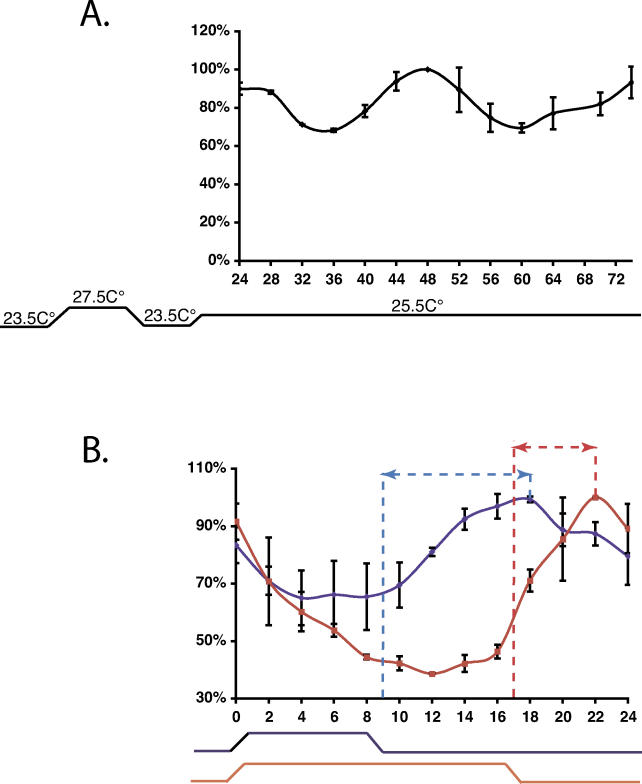
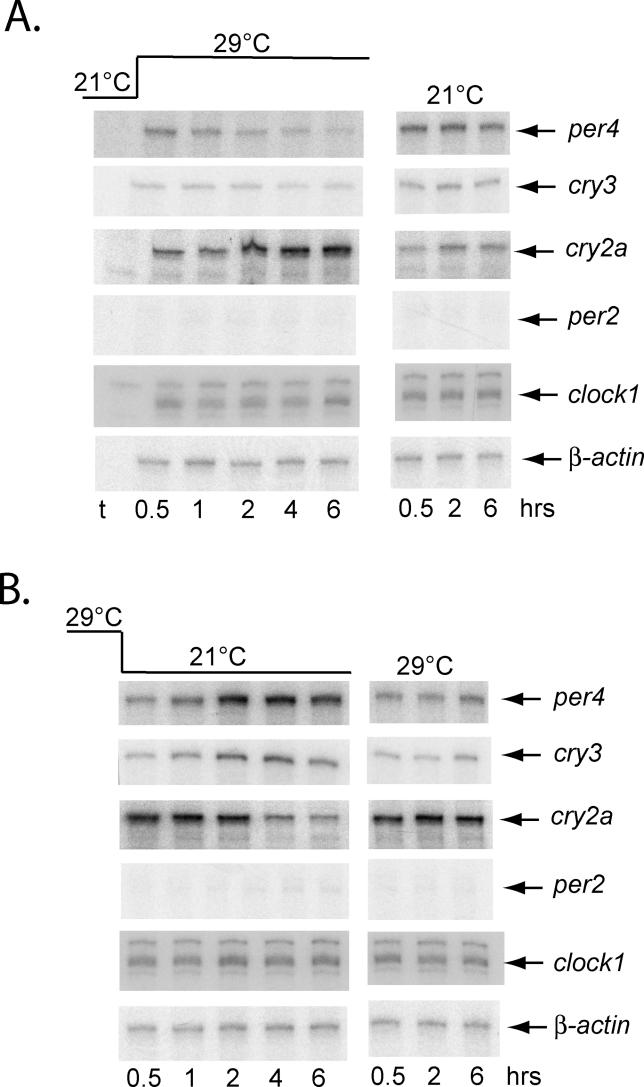
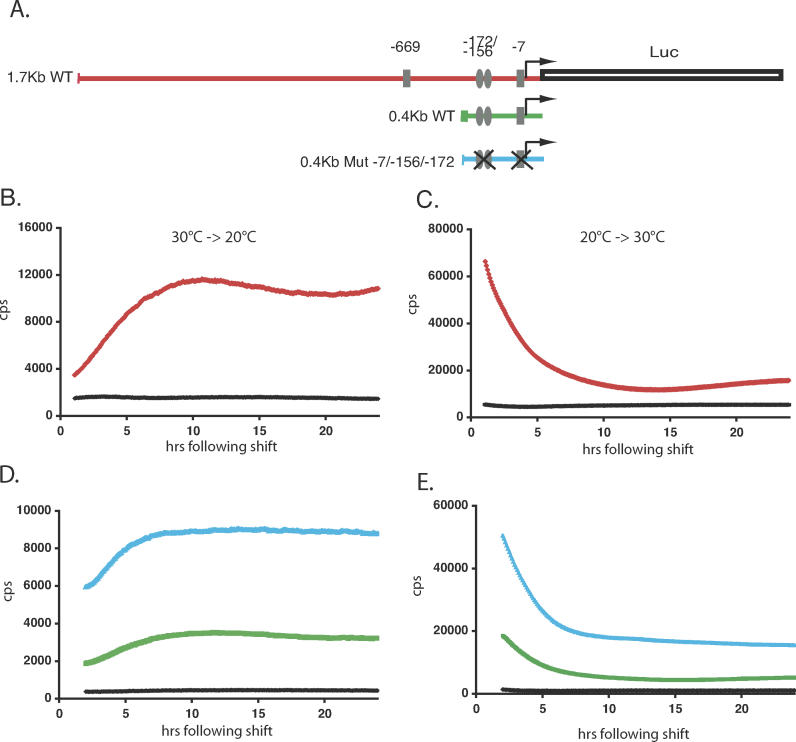
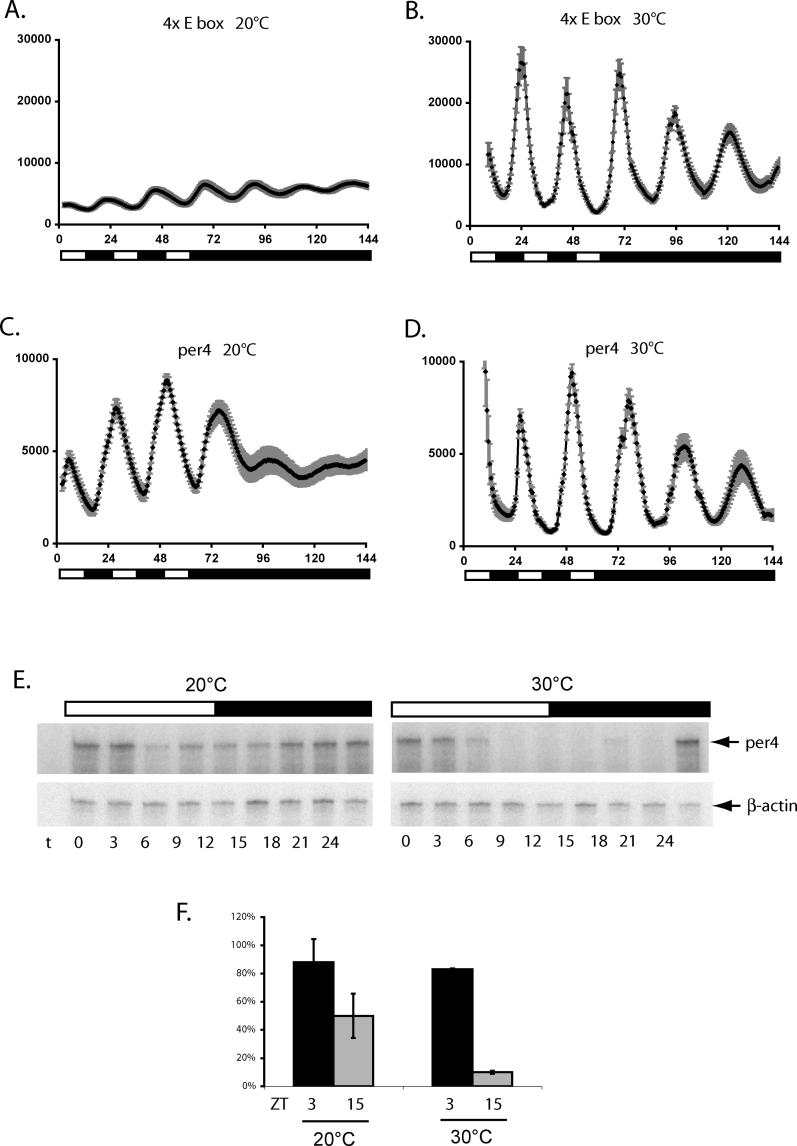
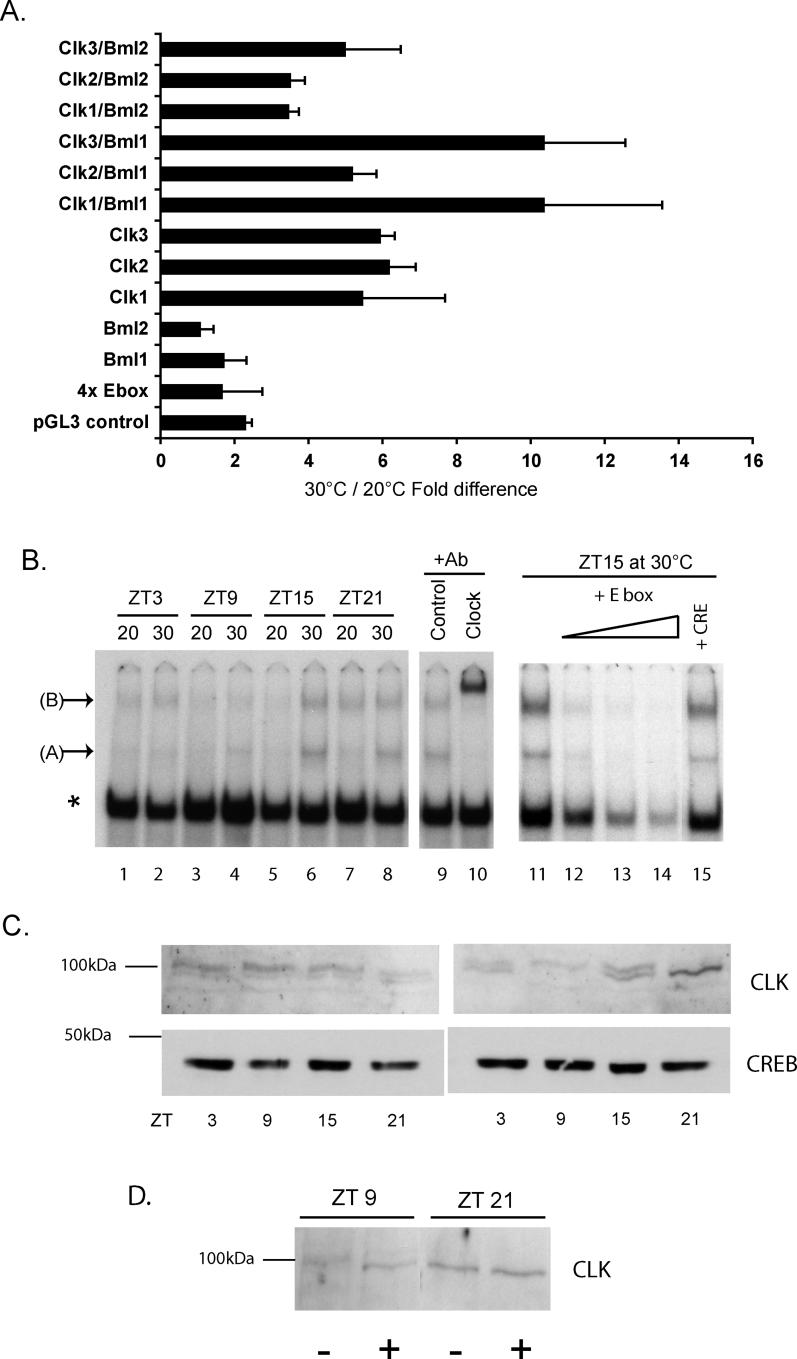
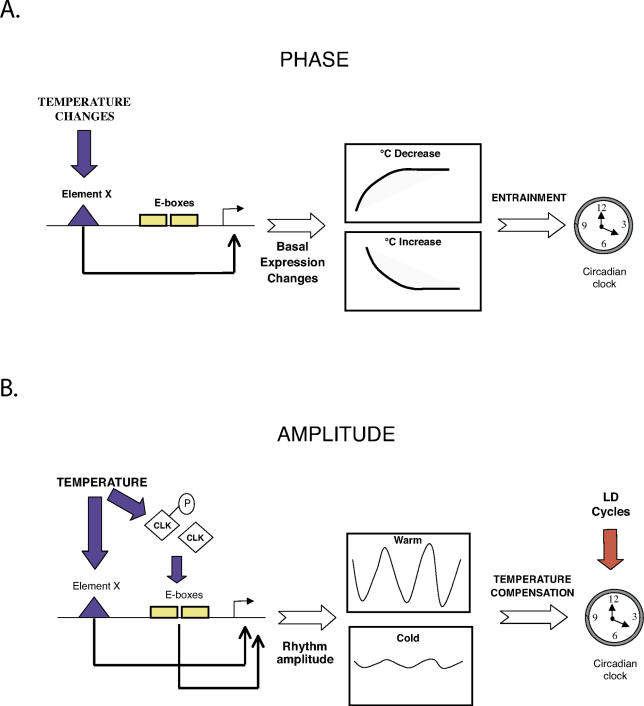
It has been well-documented that temperature influences key aspects of the circadian clock. Temperature cycles entrain the clock, while the period length of the circadian cycle is adjusted so that it remains relatively constant over a wide range of temperatures (temperature compensation). In vertebrates, the molecular basis of these properties is poorly understood. Here, using the zebrafish as an ectothermic model, we demonstrate first that in the absence of light, exposure of embryos and primary cell lines to temperature cycles entrains circadian rhythms of clock gene expression. Temperature steps drive changes in the basal expression of certain clock genes in a gene-specific manner, a mechanism potentially contributing to entrainment. In the case of the per4 gene, while E-box promoter elements mediate circadian clock regulation, they do not direct the temperature-driven changes in transcription. Second, by studying E-box-regulated transcription as a reporter of the core clock mechanism, we reveal that the zebrafish clock is temperature-compensated. In addition, temperature strongly influences the amplitude of circadian transcriptional rhythms during and following entrainment by light-dark cycles, a property that could confer temperature compensation. Finally, we show temperature-dependent changes in the expression levels, phosphorylation, and function of the clock protein, CLK. This suggests a mechanism that could account for changes in the amplitude of the E-box-directed rhythm. Together, our results imply that several key transcriptional regulatory elements at the core of the zebrafish clock respond to temperature.


Figures

Figure 1
Figure 1. Rhythmic Clock Gene Expression under LD and Temperature Cycles
Graphical summary of RPA assays are described: (A) Per4 (solid line) and cry3 mRNA expression (dashed line) in zebrafish larvae raised for 6 d either in a light (12 h) or dark (12 h) cycle at a constant temperature (25.3 °C). (B) Per4 (solid line) and cry3 mRNA expression (dashed line) in zebrafish larvae raised for 6 d in DD, under a temperature cycle of 4 °C (23.5 °C/11 h, 27.5 °C/11 h, plus 1 h for each heating and cooling phase). RNA samples were harvested during the seventh day (ZT0 is defined as the beginning of the heating and light periods). (C and D) Equivalent analysis of clock1 (solid line) and cry2a (dashed line) expression in (C) LD, and (D) temperature cycle larvae. (E) Per2 expression was assayed in LD (dashed line) or temperature cycle (ΔT) larvae (solid line). By linear regression analysis, the slope of the ΔT trace has no significant deviation from zero (R2 = 0.033 and p = 0.66, F-test). The LD cycle curve fits to a 6th-order polynomial regression model (R2 = 0.96 and Runs test for deviation from model p = 0.99). In each case, zeitgeber time is plotted on the x-axis while the relative expression levels (percentage) are plotted on the y-axis. β-actin levels were used to standardize the results. The highest band intensity in each experiment was arbitrarily defined as 100%, and then all other values were expressed as a percentage of this value. All experiments were performed in triplicate, and error bars denote the standard deviation.
Figure 2
Figure 2. Temperature Cycles Entrain the Zebrafish Circadian Clock
(A) Quantification of per4 expression levels as measured by RPA, in WT PAC-2 cells initially exposed for 6 d to a 4 °C temperature cycle and then transferred to a constant temperature (25.5 °C) for 72 h. RNA extracts were prepared from 24 h to 72 h following transfer to the constant temperature at four hourly intervals. RPA band intensities were quantified and adjusted as described in Figure 1. (B) RPA results quantifying per4 expression levels in WT PAC-2 cells exposed for 5 d to warm:cold temperature cycles (as indicated below the x-axis), including either a 8 h:16 h (blue trace), or a 16 h:8 h (red trace) cycle. The blue and red dashed lines and arrowheads indicate the delay between the warm–cold transition and the peak of per4 rhythmic expression in each temperature cycle. All experiments were performed in triplicate, and error bars denote the standard deviation.
Figure 3
Figure 3. Temperature Steps Regulate Clock Gene Expression Levels
(A) Larvae were raised in DD at 21 °C for 7 d and then shifted to 29 °C and harvested at the indicated times relative to the temperature shift (h). Controls remained at 21 °C and were harvested in parallel with the temperature shift larvae. RPA analysis of the indicated genes was then performed. “t” represents a tRNA control sample. (B) As in (A), except that 5-d-old larvae were shifted from 29 °C to 21 °C, and controls remained at 29 °C. All data are representative of at least three independent experiments.
Figure 4
Figure 4. Temperature Steps Induce Changes in per4 Gene Transcription
(A) Schematic representation of the 1.7-kb WT (red), 0.4-kb WT (green), and the 0.4-kb Mut −7/−156/−173 (blue) per4 promoter luciferase reporter constructs. E-box elements are represented by rectangles ( CACGTG) and ellipses ( AACGTG), and their positions relative to the principal transcription start site are labeled. E-boxes that have been ablated by mutation to the sequence ( CTCGAG) are shown by a cross [27]. (B) Bioluminescence from PAC-2 cells stably transfected with the 1.7-kb WT construct adapted to 30 °C and then shifted rapidly to 20 °C (red trace). During the entire assay, the plate was held inside the Topcount counting chamber, and each well was counted for 3 s at intervals of approximately 5.5 min. Bioluminescence (counts per second) is plotted against time (h) following the temperature shift. A black trace represents pGL3Control transfected cells bioluminescence. (C) Equivalent experiment to that in panel B, with cells adapted to 20 °C and shifted to 30 °C. (D and E) Cells transfected with the 0.4-kb WT and 0.4-kb Mut −7/−156/−173 constructs were subjected to the same rapid temperature decrease and increase, respectively, as described for (B) and (C). All traces represent the mean values of 16 independent wells. Each panel is representative of at least three independent experiments.
Figure 5
Figure 5. Temperature Compensation and the Amplitude of E-box-Directed Rhythmic Expression
(A) Bioluminescence profile of 4xE-box (−7) reporter cells held at 20 °C under a LD cycle and then transferred to DD conditions. Plates were counted once per hour and maintained in robotic stacking units between assays, where they were illuminated. (B) Equivalent experiment to panel A, with cells maintained at 30 °C. (C) Bioluminescence traces from 1.7-kb WT per4 reporter cells maintained at 20 °C under LD cycle and DD conditions. (D) Bioluminescence traces from 1.7-kb WT per4 reporter cells maintained at 30 °C under LD cycle and DD conditions. (E) RPA analysis of per4 expression in WT PAC-2 cells held at 20 °C and 30 °C under an LD cycle for 3 d. RNA extracts were prepared on the fourth day at 3-h intervals during one 24-h cycle. Time 0 represents ZT 0: the onset of the light period. A white and black bar above the autoradiograph indicates the duration of the light and dark periods. RPA results with a β-actin loading control are also shown. “t” represents a tRNA control sample. (F) A bar graph shows quantification of the peak (ZT3) and trough (ZT15) per4 expression values at 20 °C and 30 °C plotted as described in Figure 1, with error bars representing the standard deviation of three independent experiments. All bioluminescence traces represent the mean values of 16 independent wells. Each panel is representative of at least three independent experiments.
Figure 6
Figure 6. Temperature Influences CLK Protein Expression and Function
(A) In vitro luciferase assays of transiently transfected PAC2 cells. The combinations of CLK (Clk) and BMAL (Bml) expression vectors cotransfected with the 4x Ebox (−7) reporter plasmid are indicated for each assay result. Control cells were transfected with the reporter plasmid or with the pGL3 Control plasmid alone. Values represent the mean fold difference between luciferase activities measured in 30 °C and 20 °C, 60 h after transfection. All assays were standardized for transfection efficiency using a β-galactosidase assay. The results are based on four independent experiments, and error bars indicate the standard deviation. (B) Electrophoretic mobility shift assay of nuclear extracts from PAC-2 cells cultured at 20 °C or 30 °C on a LD cycle, and harvested at ZT3, 9, 15, and 21 (lanes 1 to 8). Three specific complexes are indicated by A, B, and an asterisk. Supershift assays of a ZT15, 30 °C extract (+Ab), used either a dopamine transporter antibody (Control) or a mouse clk antibody (Clock) (lanes 9 and 10). Complexes indicated by A, B, and an asterisk are all efficiently competed by a 25-, 50-, and 100-fold excess of cold E-box probe (lanes 12, 13, and 14, respectively, and compare with lane 11), but not with a 100-fold excess of a CRE probe (compare lane 15 with lane 11). (C) Western blotting assay using the anti-mouse CLK antibody of the same nuclear extracts tested in the electrophoretic mobility shift assay analysis of panel B. The migration of a 100-kDa marker band is shown. Below are shown western blotting results for the same extracts using an anti-mouse CREB antibody as a loading control. (D) Western blot assay of CLK protein in 30 °C extracts prepared at ZT9 or ZT21 (time points representing the trough and peak, respectively, of the CLK protein rhythm). Samples were prepared with (+) or without (−) treatment with alkaline phosphatase prior to electrophoresis and transfer. In panels B, C, and D, data are representative of at least three independent experiments.
Figure 7
Figure 7. Model for Temperature Regulation of the per4 Promoter
(A) Temperature steps entrain the phase of the clock by driving expression levels of per4 and other clock genes via a hypothetical enhancer element X. Temperature decreases result in expression increases, and vice versa. Although E-boxes ultimately mediate regulation of the per4 promoter by the entrained clock, they do not participate in the temperature-driven response. (B) Temperature influences the amplitude of rhythmic per4 expression that has been entrained by LD cycles in two ways: (1) by determining the amplitude of E-box-directed rhythmic expression, via changes in CLK protein levels, phosphorylation, and E-box binding, and (2) by driving expression changes through element X (see panel A). The promoter integrates these two regulatory mechanisms. The temperature-dependent amplitude of E-box-directed rhythmic expression would be predicted to involve the core feedback loops of the clock itself and, according to mathematical models, might thereby underlie temperature compensation.

References

    1. Sweeney BM, Hastings JW. Effects of temperature upon diurnal rhythms. Cold Spring Harb Symp Quant Biol. 1960;25:87–104. - PubMed
    1. Pittendrigh CS. On temperature independence in the clock system controlling emergence time in Drosophila . Proc Natl Acad Sci U S A. 1954;40:1018–1029. - PMC - PubMed
    1. Liu Y, Garceau NY, Loros JJ, Dunlap JC. Thermally regulated translational control of FRQ mediates aspects of temperature responses in the neurospora circadian clock. Cell. 1997;89:477–486. - PubMed
    1. Martino-Catt S, Ort DR. Low temperature interrupts circadian regulation of transcriptional activity in chilling-sensitive plants. Proc Natl Acad Sci U S A. 1992;89:3731–3735. - PMC - PubMed
    1. Pittendrigh CS. Temporal organization: Reflections of a Darwinian clock-watcher. Annu Rev Physiol. 1993;55:16–54. - PubMed

Publication types

Substances