. 2005 Sep 21:6:232.
doi: 10.1186/1471-2105-6-232.

EXPANDER--an integrative program suite for microarray data analysis

Affiliations

EXPANDER--an integrative program suite for microarray data analysis

Ron Shamir et al. BMC Bioinformatics. .

Abstract

Background: Gene expression microarrays are a prominent experimental tool in functional genomics which has opened the opportunity for gaining global, systems-level understanding of transcriptional networks. Experiments that apply this technology typically generate overwhelming volumes of data, unprecedented in biological research. Therefore the task of mining meaningful biological knowledge out of the raw data is a major challenge in bioinformatics. Of special need are integrative packages that provide biologist users with advanced but yet easy to use, set of algorithms, together covering the whole range of steps in microarray data analysis.

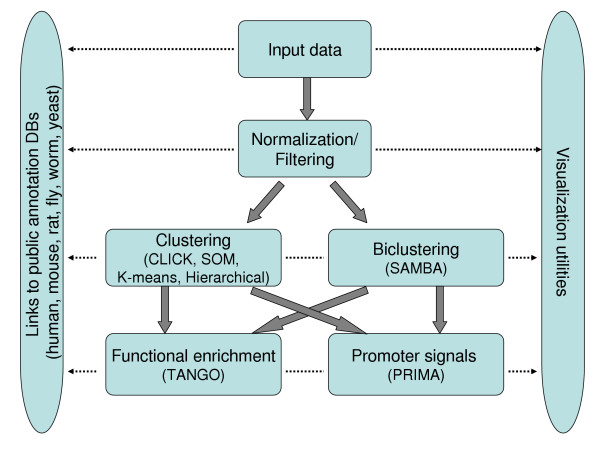
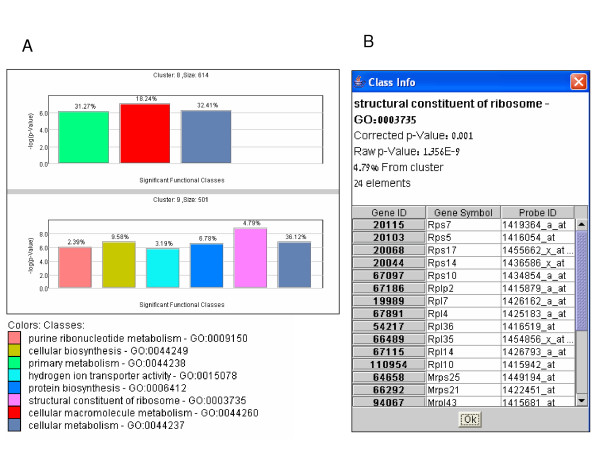
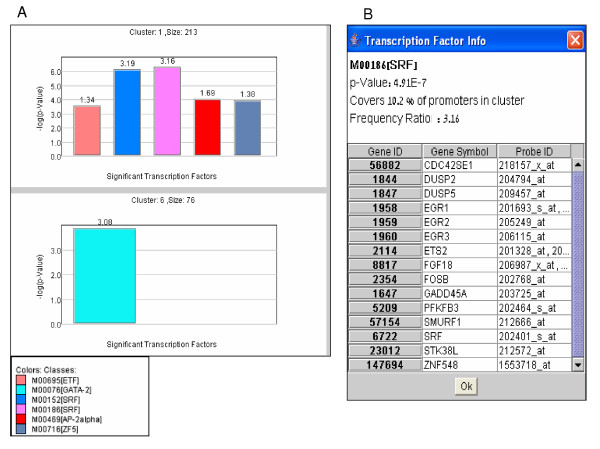
Results: Here we present the EXPANDER 2.0 (EXPression ANalyzer and DisplayER) software package. EXPANDER 2.0 is an integrative package for the analysis of gene expression data, designed as a 'one-stop shop' tool that implements various data analysis algorithms ranging from the initial steps of normalization and filtering, through clustering and biclustering, to high-level functional enrichment analysis that points to biological processes that are active in the examined conditions, and to promoter cis-regulatory elements analysis that elucidates transcription factors that control the observed transcriptional response. EXPANDER is available with pre-compiled functional Gene Ontology (GO) and promoter sequence-derived data files for yeast, worm, fly, rat, mouse and human, supporting high-level analysis applied to data obtained from these six organisms.

Conclusion: EXPANDER integrated capabilities and its built-in support of multiple organisms make it a very powerful tool for analysis of microarray data. The package is freely available for academic users at http://www.cs.tau.ac.il/~rshamir/expander.


Figures

Figure 1
Figure 1
A high level summary of EXPANDER's microarray data analysis flow and of the main algorithms implemented in each analysis step.
Figure 2
Figure 2
All-patterns display of a clustering solution. Each graph represents a specific cluster. The X-axis represents the measured conditions. The Y-axis represents (standardized) expression levels. Each cluster is represented by the mean expression pattern over all the genes assigned to it. Error bars denote ± 1 standard deviation. Clicking within a cell opens a window that lists the genes that are assigned to the cluster.
Figure 3
Figure 3
Matrix displays. (A) Unclustered expression matrix display. Each row corresponds to a gene, and each column to a biological sample. The color of the (i, j) cell in the matrix indicates the expression level of the ith gene in the jth sample. Green represents below-average expression level; Red represents above-average expression level (color scheme can be adjusted by the user). (B) The same dataset as in A, with genes ordered according to a clustering solution. Horizontal white lines separate the different clusters. (C) Unclustered similarity matrix display. The color of the (i, j) cell in the matrix represents the similarity between the expression patterns of the ith and the jth genes over all the samples (hence the matrix is symmetric). Red represents high similarity, and green represents low similarity. (D) Same as in C, with genes ordered on both axes according to a clustering solution. Clusters appear as distinct red blocks along the matrix diagonal, and similar clusters are manifested by off-diagonal reddish blocks.
Figure 4
Figure 4
Bicluster analysis. (A) A bicluster corresponds to a submatrix defined by row and column subsets. Both subsets are not known in advance. After reordering the original data matrix, it can be seen as the rectangle with the yellow border. (B) EXPANDER summarizes bicluster analysis results in a table that lists the dimensions (numbers of genes and conditions) of the biclusters identified and their scores. Clicking on a row in this table pops-up a window with the submatrix view of the selected bicluster. Below the table there are two examples of biclusters identified in a dataset comprising some 1,000 genes measured across over 70 conditions in human cells. Row and column labels are gene and condition names for the bicluster, respectively.
Figure 5
Figure 5
GO functional enrichment analysis. (A) Enriched GO categories identified by TANGO in the analyzed gene groups (clusters or biclusters) are displayed as bar diagrams; each corresponding to a specific gene group (i. e., cluster or bicluster). In these diagrams, GO categories are color-coded, and the height of a bar represents the statistical significance (-log10(p-value)) of the observed enrichment for its corresponding category. The percentage of genes in the group assigned to the enriched category is indicated above the bar. (B) Clicking on a bar pops-up a window that lists the group's genes that are associated with the corresponding GO category. In this window, genes are linked to central annotation DBs (SGD [25] for yeast, WormBase [26] for worm, FlyBase [27] for fly, and Entrez Gene [28] for human, mouse and rat) where detailed gene descriptions can be found for in-depth analysis.
Figure 6
Figure 6
Promoter cis-regulatory elements enrichment. (A) Transcription factors (TFs) whose DNA binding site signatures are over-represented in promoters of the genes assigned to the clusters are displayed in bar diagrams. Like the display for the GO analysis (Fig. 5), each diagram corresponds to a specific gene group (cluster or bicluster), TFs are color-coded and identified by the accession number of their binding site model in TRANSFAC DB. The statistical significance of the observed enrichment for a TF is represented by the height of its bar (-log10(p-value)). The TF enrichment factor, which is the ratio between the prevalence of the TF hits in the gene group and in the background set of promoters, is indicated above the bar. (B) Clicking on a specific bar pops-up a window that lists the genes in the group whose promoters were found to contain a hit for that TF. In this window, genes are linked to central annotation DB of the analyzed organism as specified in the legend of Figure 5.

Similar articles

Cited by

References

    1. Bolstad BM, Irizarry RA, Astrand M, Speed TP. A comparison of normalization methods for high density oligonucleotide array data based on variance and bias. Bioinformatics. 2003;19:185–193. doi: 10.1093/bioinformatics/19.2.185. - DOI - PubMed
    1. Irizarry RA, Hobbs B, Collin F, Beazer-Barclay YD, Antonellis KJ, Scherf U, Speed TP. Exploration, normalization, and summaries of high density oligonucleotide array probe level data. Biostatistics. 2003;4:249–264. doi: 10.1093/biostatistics/4.2.249. - DOI - PubMed
    1. Eisen MB, Spellman PT, Brown PO, Botstein D. Cluster analysis and display of genome-wide expression patterns. Proc Natl Acad Sci U S A. 1998;95:14863–14868. doi: 10.1073/pnas.95.25.14863. - DOI - PMC - PubMed
    1. Tamayo P, Slonim D, Mesirov J, Zhu Q, Kitareewan S, Dmitrovsky E, Lander ES, Golub TR. Interpreting patterns of gene expression with self-organizing maps: methods and application to hematopoietic differentiation. Proc Natl Acad Sci U S A. 1999;96:2907–2912. doi: 10.1073/pnas.96.6.2907. - DOI - PMC - PubMed
    1. Al-Shahrour F, Diaz-Uriarte R, Dopazo J. FatiGO: a web tool for finding significant associations of Gene Ontology terms with groups of genes. Bioinformatics. 2004;20:578–580. doi: 10.1093/bioinformatics/btg455. - DOI - PubMed

Publication types

MeSH terms

LinkOut - more resources