Construction and validation of a Bovine Innate Immune Microarray
- PMID: 16176586
- PMCID: PMC1261263
- DOI: 10.1186/1471-2164-6-135
Construction and validation of a Bovine Innate Immune Microarray
Abstract
Background: Microarray transcript profiling has the potential to illuminate the molecular processes that are involved in the responses of cattle to disease challenges. This knowledge may allow the development of strategies that exploit these genes to enhance resistance to disease in an individual or animal population.
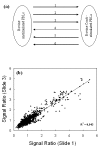
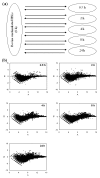
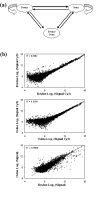
Results: The Bovine Innate Immune Microarray developed in this study consists of 1480 characterised genes identified by literature searches, 31 positive and negative control elements and 5376 cDNAs derived from subtracted and normalised libraries. The cDNA libraries were produced from 'challenged' bovine epithelial and leukocyte cells. The microarray was found to have a limit of detection of 1 pg/microg of total RNA and a mean slide-to-slide correlation co-efficient of 0.88. The profiles of differentially expressed genes from Concanavalin A (ConA) stimulated bovine peripheral blood lymphocytes were determined. Three distinct profiles highlighted 19 genes that were rapidly up-regulated within 30 minutes and returned to basal levels by 24 h; 76 genes that were up-regulated between 2-8 hours and sustained high levels of expression until 24 h and 10 genes that were down-regulated. Quantitative real-time RT-PCR on selected genes was used to confirm the results from the microarray analysis. The results indicate that there is a dynamic process involving gene activation and regulatory mechanisms re-establishing homeostasis in the ConA activated lymphocytes. The Bovine Innate Immune Microarray was also used to determine the cross-species hybridisation capabilities of an ovine PBL sample.
Conclusion: The Bovine Innate Immune Microarray has been developed which contains a set of well-characterised genes and anonymous cDNAs from a number of different bovine cell types. The microarray can be used to determine the gene expression profiles underlying innate immune responses in cattle and sheep.
Figures


Similar articles
-
Construction and application of a bovine immune-endocrine cDNA microarray.Vet Immunol Immunopathol. 2004 Sep;101(1-2):1-17. doi: 10.1016/j.vetimm.2003.10.011. Vet Immunol Immunopathol. 2004. PMID: 15261689
-
Microarray analysis of selection lines from outbred populations to identify genes involved with nematode parasite resistance in sheep.Physiol Genomics. 2005 Mar 21;21(1):59-69. doi: 10.1152/physiolgenomics.00257.2004. Epub 2004 Dec 28. Physiol Genomics. 2005. PMID: 15623564
-
Identification of bovine leukemia virus tax function associated with host cell transcription, signaling, stress response and immune response pathway by microarray-based gene expression analysis.BMC Genomics. 2012 Mar 28;13:121. doi: 10.1186/1471-2164-13-121. BMC Genomics. 2012. PMID: 22455445 Free PMC article.
-
Gene expression profiling of peripheral blood mononuclear cells (PBMC) from Mycobacterium bovis infected cattle after in vitro antigenic stimulation with purified protein derivative of tuberculin (PPD).Vet Immunol Immunopathol. 2006 Sep 15;113(1-2):73-89. doi: 10.1016/j.vetimm.2006.04.012. Epub 2006 Jun 19. Vet Immunol Immunopathol. 2006. PMID: 16784781
-
Extraction of Innate Immune Genes in Dairy Cattle and the Regulation of Their Expression in Early Embryos.Genes (Basel). 2024 Mar 18;15(3):372. doi: 10.3390/genes15030372. Genes (Basel). 2024. PMID: 38540431 Free PMC article. Review.
Cited by
-
Microarray analysis of differential gene expression profiles in blood cells of naturally BLV-infected and uninfected Holstein-Friesian cows.Mol Biol Rep. 2017 Feb;44(1):109-127. doi: 10.1007/s11033-016-4088-6. Epub 2016 Nov 3. Mol Biol Rep. 2017. PMID: 27812893 Free PMC article.
-
Characterization of genes for beef marbling based on applying gene coexpression network.Int J Genomics. 2014;2014:708562. doi: 10.1155/2014/708562. Epub 2014 Jan 30. Int J Genomics. 2014. PMID: 24624372 Free PMC article.
-
Characterization of ovine hepatic gene expression profiles in response to Escherichia coli lipopolysaccharide using a bovine cDNA microarray.BMC Vet Res. 2006 Nov 29;2:34. doi: 10.1186/1746-6148-2-34. BMC Vet Res. 2006. PMID: 17134499 Free PMC article.
-
Scaffold-free approach produces neocartilage tissue of similar quality as the use of HyStem™ and Hydromatrix™ scaffolds.J Mater Sci Mater Med. 2017 Apr;28(4):59. doi: 10.1007/s10856-017-5870-2. Epub 2017 Feb 16. J Mater Sci Mater Med. 2017. PMID: 28210971 Free PMC article.
-
Identification of Gene Modules and Hub Genes Involved in Mastitis Development Using a Systems Biology Approach.Front Genet. 2020 Jul 13;11:722. doi: 10.3389/fgene.2020.00722. eCollection 2020. Front Genet. 2020. PMID: 32754201 Free PMC article.
References
-
- Moser RJ, Reverter A, Kerr CA, Beh KJ, Lehnert SA. A mixed-model approach for the analysis of cDNA microarray gene expression data from extreme-performing pigs after infection with Actinobacillus pleuropneumoniae. J Anim Sci. 2004;82:1261–71. - PubMed
-
- Burton JL, Madsen SA, Yao J, Sipkovsky SS, Coussens PM, Agger JF, Toft N. An Immunogenomics Approach to Understanding Periparturient Immunosuppression and Mastitis Susceptibility in Dairy Cows. Acta Veterinaria Scandinavica, Supplementum. 2003. pp. 71–88. - PubMed
Publication types
MeSH terms
Substances
LinkOut - more resources
Full Text Sources
Medical

