Comparative Study
. 2005 Sep 21;25(38):8637-49.
doi: 10.1523/JNEUROSCI.1902-05.2005.

The ventral pallidum and hedonic reward: neurochemical maps of sucrose "liking" and food intake

Affiliations
Comparative Study

The ventral pallidum and hedonic reward: neurochemical maps of sucrose "liking" and food intake

Kyle S Smith et al. J Neurosci. .

Erratum in

  • J Neurosci. 2005 Oct 12;25(41):9554

Abstract

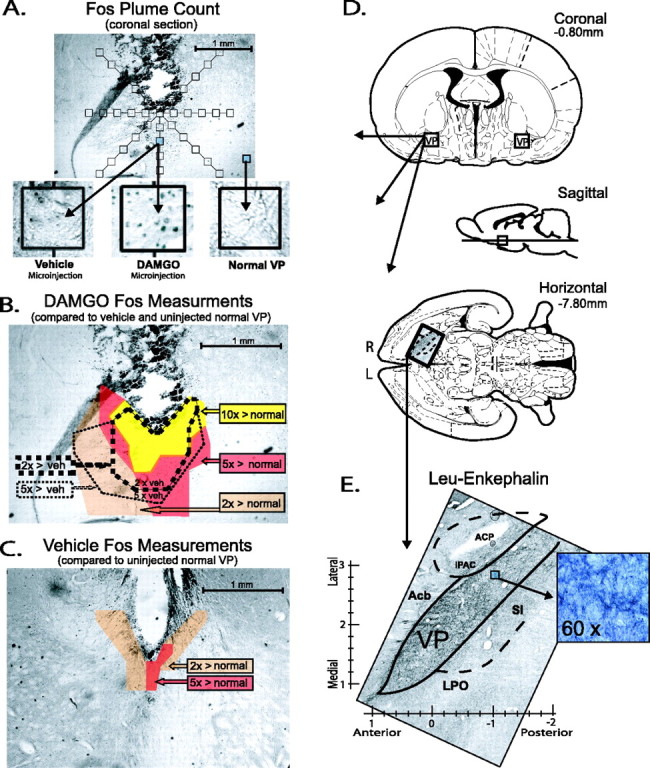
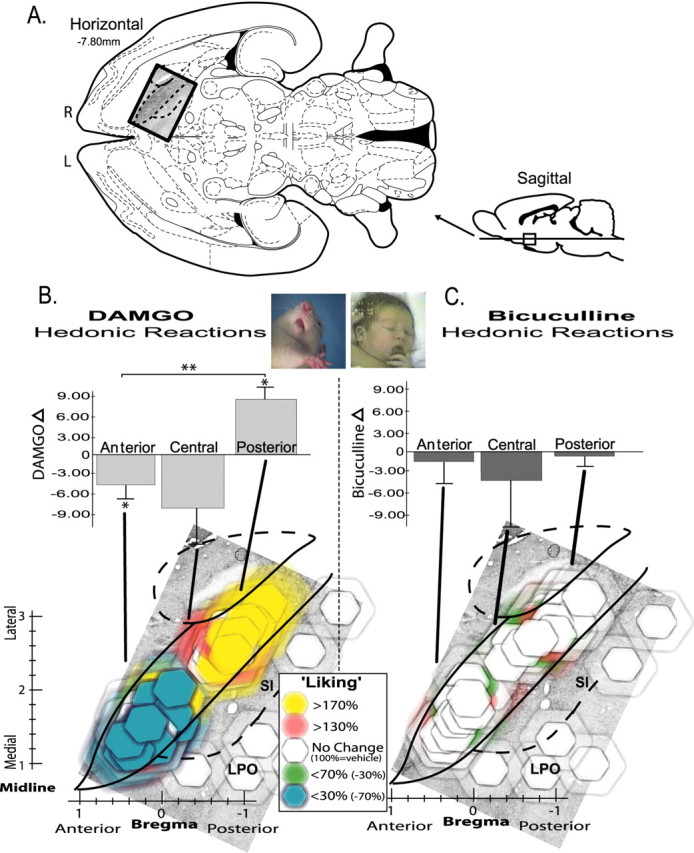
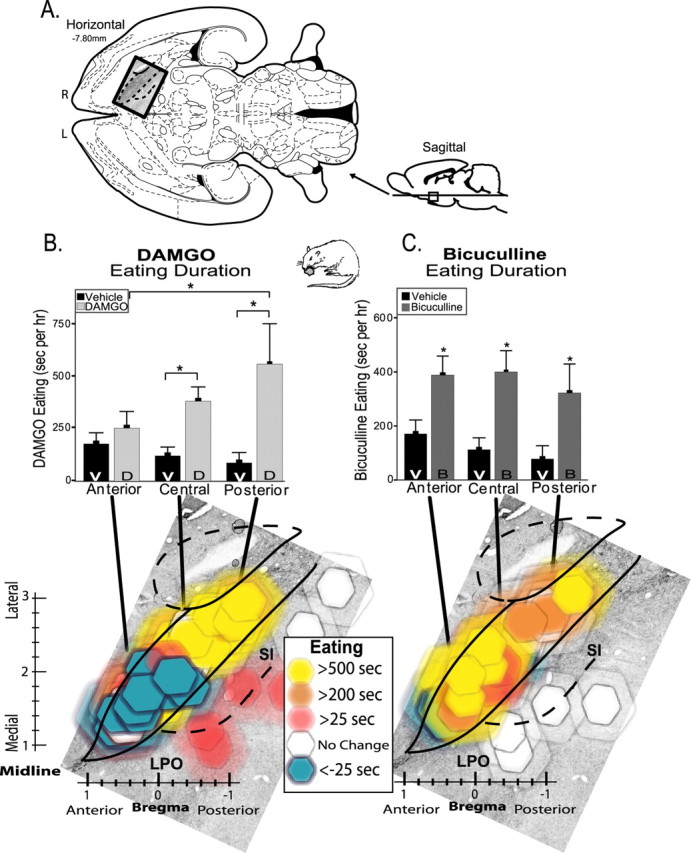
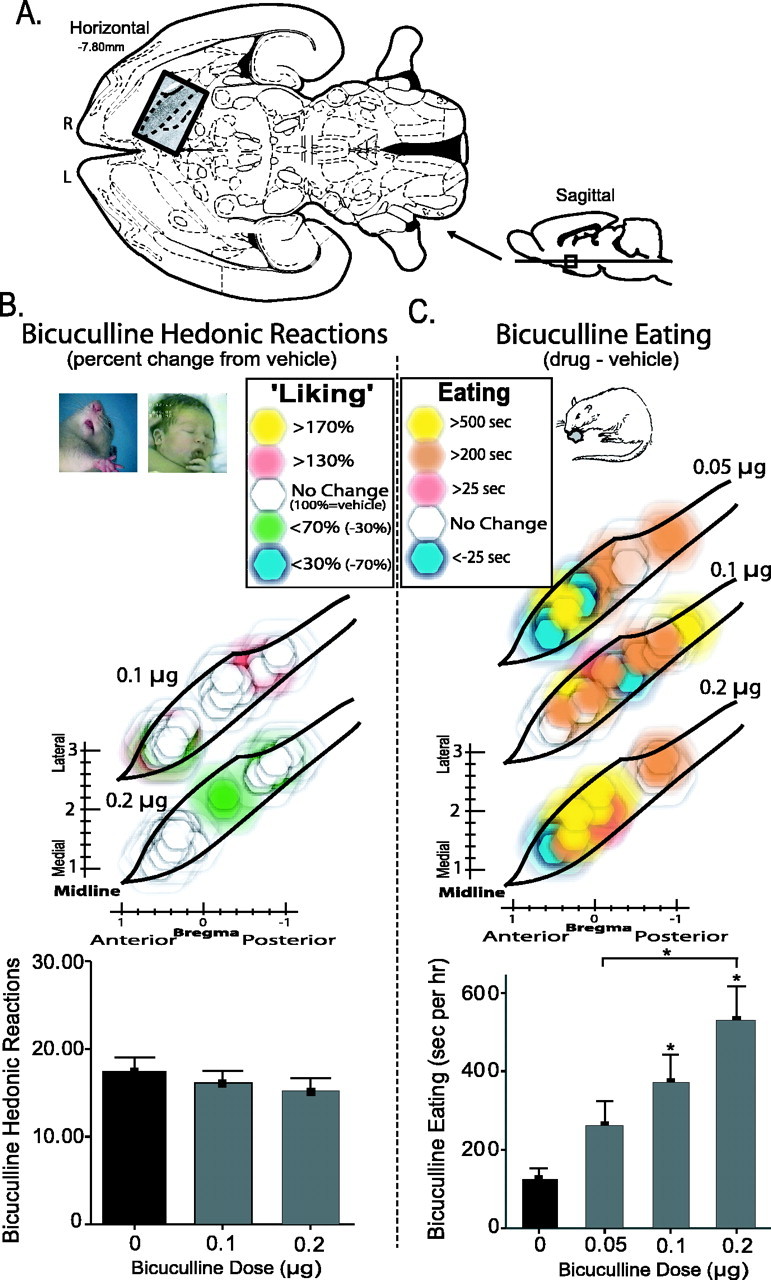
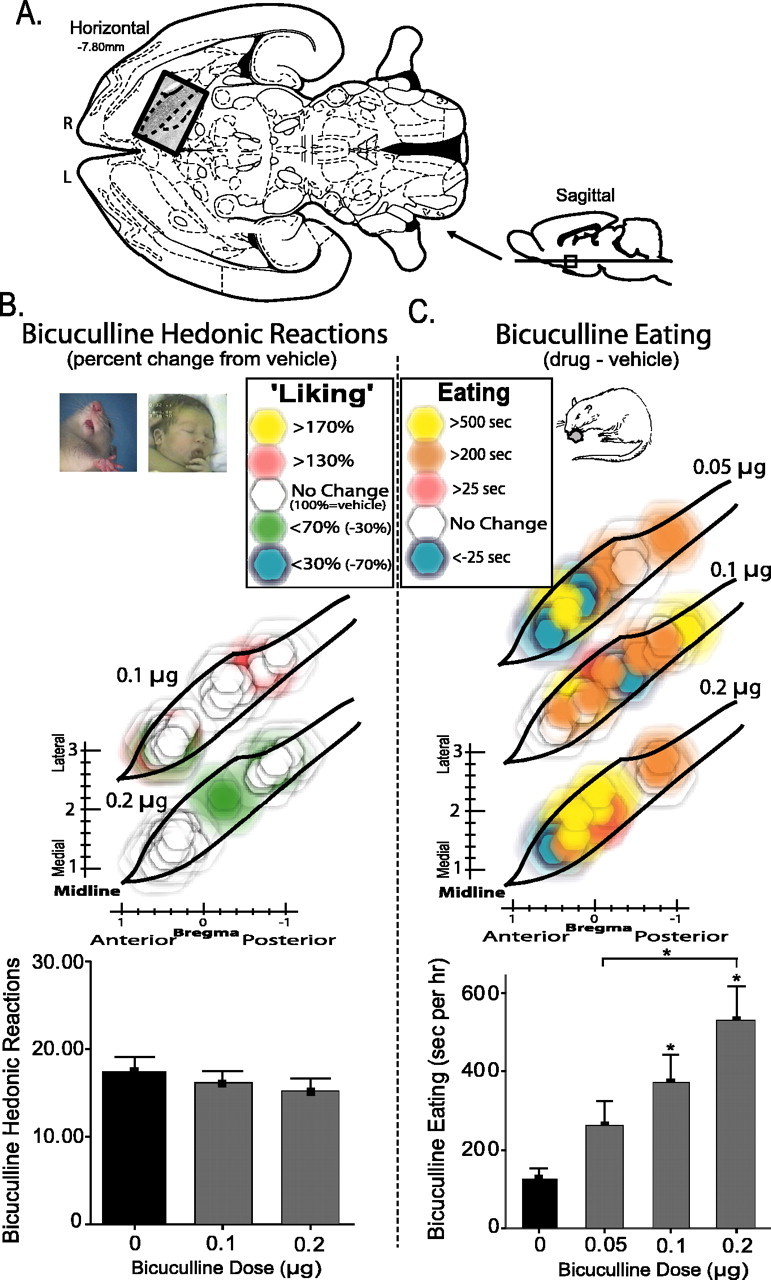
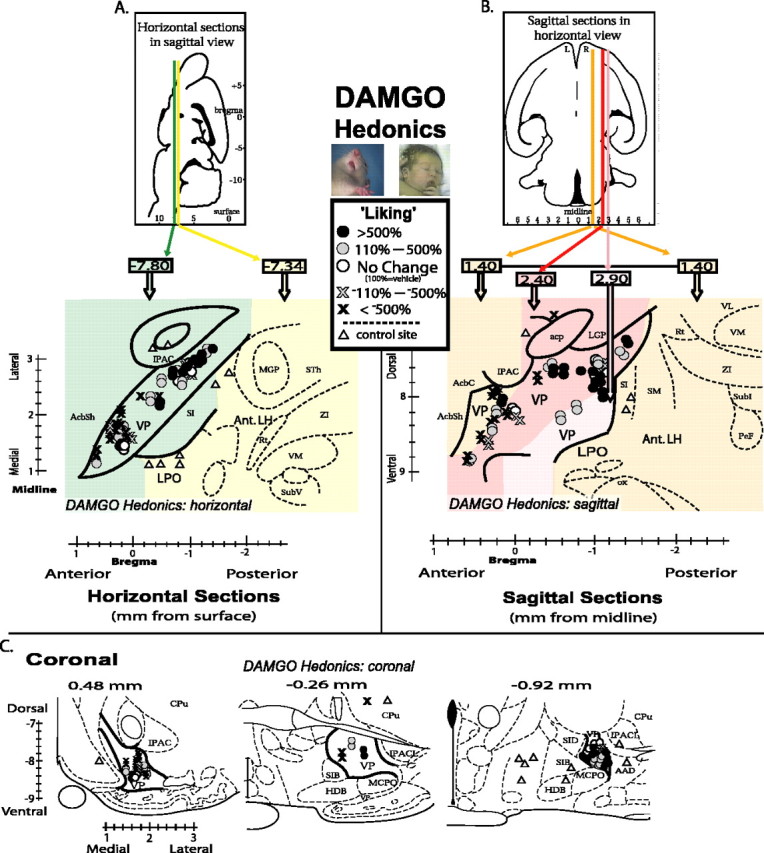
How are natural reward functions such as sucrose hedonic impact and the motivation to eat generated within the ventral pallidum (VP)? Here, we used a novel microinjection and functional mapping procedure to neuroanatomically localize and neurochemically characterize substrates in the VP that mediate increases in eating behavior and enhancements in taste hedonic "liking" reactions. The mu-opioid agonist D-Ala2-N-Me-Phe4-Glycol5-enkephalin (DAMGO) caused increased hedonic "liking" reactions to sucrose only in the posterior VP but conversely suppressed "liking" reactions in the anterior and central VP. DAMGO similarly stimulated eating behavior in the posterior and central VP and suppressed eating in the anterior VP. In contrast, the GABAA antagonist bicuculline increased eating behavior at all VP sites, yet completely failed to enhance sucrose "liking" reactions at any site. These results reveal that VP generation of increased food reward and increased eating behavior is related but dissociable. Hedonic "liking" and eating are systematically mapped in a neuroanatomically and neurochemically interactive manner in the VP.


Figures

Figure 1.
Figure 1.
Fos plumes and VP perspectives. A, Coronal section showing point sample positions used to identify local Fos plumes around microinjection site (125 × 125 μm blocks on radial arms extending from center; 5× magnification). Insets show examples of Fos densities after vehicle or DAMGO microinjection in posterior VP (0.01 μg in 0.5 μl; 75 min after microinjection; 40× magnification) or from uninjected normal VP tissue. B, Example of Fos plume after 0.01 μg DAMGO microinjection, as mapped by several criteria. Colors show zones of absolute Fos expression elevation above normal VP tissue levels after DAMGO microinjection (yellow, absolute increases of > 10×; red, > 5×; orange, > 2 ×). Dotted lines show zones of relative Fos increase compared with after vehicle (veh) microinjection levels measured at equivalent points surrounding cannula site (thick dotted line, > 2× relative increase; thin dotted line, > 5×). Bicuculline caused Fos plumes of similar size (0.2 μg; data not shown). C, Moderately low Fos expression after vehicle microinjection (but elevated because of damage or vehicle pressure/composition over normal spontaneous Fos levels). D, Coronal, sagittal, and horizontal planes containing VP [from Paxinos and Watson (1998)]. E, Entire VP and boundaries are visible in single horizontal section stained for leu-enkephalin, and observed boundaries were used to adjust VP atlas boundaries when mapping VP functions (5× magnification). Inset shows 60× magnification of posterior VP. ACP, Posterior limb of the anterior commissure; IPAC, interstitial nucleus of the posterior limb of the anterior commissure; Acb, nucleus accumbens; SI, substantia innominata; LPO, lateral preoptic area.
Figure 2.
Figure 2.
Hedonic “liking” generation maps. Changes in hedonic impact of sucrose caused by VP microinjections of DAMGO versus bicuculline (assessed by taste reactivity; all doses included). A, Location of VP in horizontal and sagittal sections (Paxinos and Watson, 1998). R, Right; L, left. B, Opioid hedonic generation map, DAMGO effects on sucrose “liking.” Horizontal view of VP (superimposed on enkephalin stain) shows changes in positive sucrose-elicited “liking” reactions caused by DAMGO microinjections, expressed as within-subject percentage changes from vehicle microinjections at the same sites (vehicle, 100%). Bilateral VP sites from left and right brains of each rat are collapsed together here into a unilateral single map of VP (right brain) for better simplicity (all doses represented). Colors denote direction and intensity of “liking” change from vehicle levels, and symbol size shows the diameter of intense Fos plumes (10× elevation above normal; 0.28 mm radius for 0.01 μg DAMGO), surrounded by semitransparent halos that show diameter of moderate Fos plumes (0.49 mm radius). Bar graph above shows average intensity of change caused by microinjections in each ⅓ region of VP: anterior, central, or posterior (within-subject difference score of drug minusvehicle; *p < 0.05; **p < 0.01). C, GABAA blockade hedonic generation map. Bicuculline effects on sucrose “liking” (0.2μg bicuculline; otherwise same as B). Photographs show example hedonic “liking” reactions to sucrose by rat and human infant [modified from Steiner et al. (2001)] (also see “liking” examples in supplemental movies, available at www.jneurosci.org as supplemental material). Error bars represent SEM. SI, Substantia innominata; LPO, lateral preoptic area.
Figure 3.
Figure 3.
Eating behavior generation maps. Changes in eating duration caused by VP microinjections of DAMGO versus bicuculline. A, Location of VP maps in horizontal and sagittal sections (Paxinos and Watson, 1998) (horizontal section superimposed on enkephalin stain). R, Right; L, left. B, DAMGO (D)-induced changes in duration of eating behavior compared with after vehicle (V) microinjections at same sites. Bar graph shows cumulative average duration of eating behavior after vehicle versus DAMGO microinjection in anterior, central, and posterior regions of VP (*p < 0.05). Bottom color map shows DAMGO-evoked changes in eating behavior duration for each microinjection site (compared with vehicle). Colors represent direction and intensity of change in eating (drug minus vehicle); symbol size represents Fos plume spread (as Fig. 2). Bilateral VP sites from left and right brains of each rat are collapsed together here into a unilateral single map of VP (right brain) for better simplicity (all doses represented). C, Bicuculline (B)-evoked generation of eating behavior. Bar graph and color map otherwise same as B. Error bars represent SEM. SI, Substantia innominata; LPO, lateral preoptic area.
Figure 4.
Figure 4.
Functional dose–response VP maps of DAMGO effects on hedonic “liking” and eating behavior. A, Location of VP maps in horizontal and sagittal sections (Paxinos and Watson, 1998) (horizontal insert overlaid with enkephalin stain). R, Right; L, left. B, DAMGO effects on sucrose “liking.” Color function maps shows change in hedonic “liking” reactions elicited by sucrose taste after each dose of DAMGO (0.01, 0.1, 0.25 μg) compared with vehicle (percentage change from vehicle, 100% at same sites). Symbols as in Figures 2 and 3. The bottom bar graph represents number of positive hedonic “liking” reactions after DAMGO or vehicle in anterior and posterior halves of VP (*p < 0.05; **p < 0.01). C, DAMGO-evoked eating behavior. Color maps showe ating durations evoked by each dose of DAMGO (0.01, 0.1, 0.25 μg) compared with vehicle (absolute change). Bar graph represents eating total duration in anterior and posterior VP halves after vehicle or each DAMGO dose. Error bars represent SEM.
Figure 5.
Figure 5.
Functional dose–response VP maps of bicuculline effects. A, Location of VP maps in horizontal and sagittal sections (Paxinos and Watson, 1998)(horizontal insert overlaid with enkephalin stain). R, Right; L, left. B, Bicuculline sucrose “liking.” Color function maps show changes in hedonic “liking” reactions elicited by sucrose taste after each dose of bicuculline (0.1, 0.2 μg) compared with vehicle (percentage change from vehicle, 100% at same site). Symbols are as in Figures 2, 3, 4. The bottom bar graph represents total number of positive hedonic “liking” responses to sucrose after bicuculline or vehicle microinjections (no anatomical differences existed for bicuculline eating effects, and so all VP sites were combined). C, Bicuculline-evoked increases in eating behavior. Color maps shows relative increase in eating duration evoked by each dose of bicuculline (0.05, 0.1, 0.2 μg) compared with vehicle at the same site. Bar graph represents cumulative eating durations evoked by vehicle and by each bicuculline dose (*p < 0.05). Error bars represent SEM.
Figure 6.
Figure 6.
Pinpoint maps of DAMGO-induced “liking” effects in the VP. Each site is mapped in horizontal, sagittal, and coronal planes for three-dimensional comparison. A, Horizontal map shows the entire VP best. The entire VP can be captured in a single horizontal plane, but control sites in lateral hypothalamus outside VP are at a more shallow depth. Horizontal planes of different depth of are represented by colors of background (green, –7.80 mm ventral; yellow, –7.34 mm ventral). Symbol locations show center of microinjection sites, and symbol types show intensity of DAMGO-caused change in sucrose-elicited hedonic “liking” reactions (percentage change from vehicle at same sites; vehicle, 100%; circle shades denote DAMGO-induced increases; cross shades denote DAMGO-induced reductions below vehicle control levels; triangles denote control sites in brain structures outside of VP). Bilateral VP sites from left and right brains of each rat are collapsed together here into a unilateral single map of VP (right brain) for better simplicity (all doses represented). B, Sagittal map of VP. Several sagittal planes of different laterality must be compressed together to represent entire VP in one sagittal map; plane literalities are represented by background colors. R, Right; L, left (orange, 1.40 mm; red, 2.40 mm; pink, 2.90 mm). Symbol locations and shades as in A. C, Coronal maps in three separate anterior–posterior planes (0.48, –0.26, –0.92 mm). IPAC, Interstitial nucleus of the posterior limb of the anterior commissure; AcbSh, Nucleus accumbens shell; MGP, medial globus pallidus; STh, subthalamic nucleus; ZI, zona incerta; Rt, reticular thalamic nucleus; VM, ventromedial thalamic nucleus; SubV, ventral submedius thalamic nucleus; acp, posterior part of the anterior commissure; AcbC, nucleus accumbens core; mfb, medial forebrain bundle; SM, stria medullaris of thalamus; LGP, lateral globus pallidus; VL, ventrolateral thalamic nucleus; Subl, subincertal nucleus; PeF, perifornical nucleus; ox, optic chiasm; SIB, basal substantia innominata; HDB, nucleus of horizontal limb of diagonal band; MCPO, magnocellular preoptic nucleus; SID, dorsal substantia innominata; AAD, dorsal anterior amygdaloid area; IPACL, lateral part of interstitial nucleus of the posterior limb of the anterior commissure.

References

    1. Abe S, Suzuki T, Endo K, Hori T, Arai H (2005) Effects of single and repeated phencyclidine administration on [3H]flunitrazepam binding in rat brain. Prog Neuropsychopharmacol Biol Psychiatry 29: 133–140. - PubMed
    1. Bengtson CP, Osborne PB (1999) Electrophysiological properties of anatomically identified ventral pallidal neurons in rat brain slices. Ann NY Acad Sci 877: 691–694. - PubMed
    1. Bengtson CP, Osborne PB (2000) Electrophysiological properties of cholinergic and noncholinergic neurons in the ventral pallidal region of the nucleus basalis in rat brain slices. J Neurophysiol 83: 2649–2660. - PubMed
    1. Berridge KC (2000) Measuring hedonic impact in animals and infants: microstructure of affective taste reactivity patterns. Neurosci Biobehav Rev 24: 173–198. - PubMed
    1. Berridge KC (2003) Pleasures of the brain. Brain Cogn 52: 106–128. - PubMed

Publication types