Comparative Study
. 2005 Sep 21;25(38):8776-87.
doi: 10.1523/JNEUROSCI.2650-05.2005.

Dendritic excitability of mouse frontal cortex pyramidal neurons is shaped by the interaction among HCN, Kir2, and Kleak channels

Affiliations
Comparative Study

Dendritic excitability of mouse frontal cortex pyramidal neurons is shaped by the interaction among HCN, Kir2, and Kleak channels

Michelle Day et al. J Neurosci. .

Abstract

Dendritically placed, voltage-sensitive ion channels are key regulators of neuronal synaptic integration. In several cell types, hyperpolarization/cyclic nucleotide gated (HCN) cation channels figure prominently in dendritic mechanisms controlling the temporal summation of excitatory synaptic events. In prefrontal cortex, the sustained activity of pyramidal neurons in working memory tasks is thought to depend on the temporal summation of dendritic excitatory inputs. Yet we know little about how this is accomplished in these neurons and whether HCN channels play a role. To gain a better understanding of this process, layer V-VI pyramidal neurons in slices of mouse prelimbic and infralimbic cortex were studied. Somatic voltage-clamp experiments revealed the presence of rapidly activating and deactivating cationic currents attributable to HCN1/HCN2 channels. These channels were open at the resting membrane potential and had an apparent half-activation voltage near -90 mV. In the same voltage range, K+ currents attributable to Kir2.2/2.3 and K+-selective leak (Kleak) channels were prominent. Computer simulations grounded in the biophysical measurements suggested a dynamic interaction among Kir2, Kleak, and HCN channel currents in shaping membrane potential and the temporal integration of synaptic potentials. This inference was corroborated by experiment. Blockade of Kir2/Kleak channels caused neurons to depolarize, leading to the deactivation of HCN channels, the initiation of regular spiking (4-5 Hz), and enhanced temporal summation of EPSPs. These studies show that HCN channels are key regulators of synaptic integration in prefrontal pyramidal neurons but that their functional contribution is dependent on a partnership with Kir2 and Kleak channels.


Figures

Figure 1.
Figure 1.
Pyramidal neurons in mouse PrL/IL cortex have fast hyperpolarization-induced voltage sag. A, Left, A slice of mouse brain containing PrL/IL cortex (adapted from Franklin and Paxinos, 1997). Right, Biocytin-filled deep-layer (V–VI) PPN from the outlined area in A. The PPN was approximately reconstructed for clearer visualization of the fine dendritic processes that can be seen extending to the medial pial surface of the slice. B, Whole-cell current-clamp recording from the PPN in B showing classic initial doublet followed by steady firing during depolarization current injection and fast sag initiated by hyperpolarizing current injection. C, Left, Control current-clamp recording from a PPN at rest with current steps from –200 to +200 pA. In the control condition, the cell fired spikes at 150–200 pA of current injection. Right, Same cell >10 min after application of 50 μm ZD-7288. The cell hyperpolarized 4 mV while firing spikes with less current injection (50–100 pA), and the voltage sag was abolished.
Figure 2.
Figure 2.
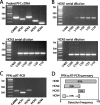
PrL/IL pyramidal neurons primarily express HCN1 and HCN2 mRNAs. A, Positive control for scRT-PCR experiments showing that mRNAs from HCN1–HCN4 and CaMKII were all expressed within the PrL/IL cortex. B, A set of serial dilution experiments from pooled PrL/IL tissue showed that HCN1–HCN4 mRNA transcripts are expressed in cells in this brain region. HCN2 and HCN3 showed the most robust expression, followed by HCN1 (HCN4 showed the weakest expression with signal loss after 1:10 dilution and is therefore not shown). C, Individual cell representative of ∼40% of single cells profiled showing pronounced HCN1 mRNA expression with weak HCN2 expression. D, Graph of the detection frequency of HCN1–HCN4 mRNA transcripts in 31 individual CaMKII-positive cells profiled.
Figure 3.
Figure 3.
HCN channels rapidly activate at hyperpolarized membrane potentials. A, Total current activated by 500 ms hyperpolarizing voltage steps from –50 to –120 mV in 10 mV increments. Each step was followed by a 250 ms step to –120 mV to maximally activate HCN channels. B, Hyperpolarization-activated currents that were blocked by application of ZD-7288 (50 μm). Currents were isolated by subtracting control currents (A) from those evoked in the presence of ZD-7288. C, Left, Currents generated by activation of HCN channels were well fit between the dashed lines with a monoexponential equation (red line); channels were activated by holding the cell at –50 mV and stepping to–120 mV at 10 mV increments. Right, Deactivation of HCN channels generated currents that were also fit with a monoexponential function; the membrane potential was held at –120 mV (500 ms) to activate channels and then stepped back to potentials between –70 and –40 mV in 10 mV increments. D, The mean activation (filled black) and deactivation (filled blue) time constants were derived from the fits as in C and plotted against the holding potential (n = 5). For graphical presentation, the resulting plot was then itself fit with equal weight being given to the overlapping data points. Also plotted are the maximal conductance estimates from the currents shown in B; these data points were fitwith a Boltzmann function, having a half-activation voltage of –87 mV and a slope factor of 11 mV. E, Computer simulation of the results in B assuming that the HCN channel density increased by a factor of 10 from the soma to the first branch point of the apical dendrite or to the end of the basal dendrites. F, Plot of the steady-state activation voltage dependence and HCN channel gating kinetics as seen from the soma (black) compared with the actual properties of the dendritic channels (red).
Figure 4.
Figure 4.
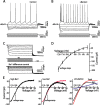
PPNs express Ba2+-sensitive, inwardly rectifying K+ channels and linear Kleak channels. A, Whole-cell current-clamp records from a cell at rest during a series of hyperpolarizing and depolarizing steps from –200 to 50 pA. B, Same cell and step protocol after Ba2+ (200 μm) application. During Ba2+ treatment, a negative current had to be injected to repolarize the cell back to the control resting membrane potential that was below the threshold for generating action potentials. These traces show an apparent increase in membrane resistance while the voltage sag remains intact. C, Somatic voltage-clamp analysis of the current–voltage relationship of Kir2 currents. Top, Total current activated by 500 ms hyperpolarizing voltage steps from –50 to –120 mV in 10 mV increments in the presence of TTX (1 μm). Bottom, The Ba2+-sensitive current isolated by subtraction. D, Graph showing peak Kir2 current plotted against the step potential generated from averaged data (±SEM; n = 5). E, Left, Ba2+-sensitive (200 μm) current trace generated from a 100 ms ramp from –120 to –50 mV in the presence of TTX and ZD-7288 (black trace). Middle, The black trace shows the current sensitive to lower Ba2+ (50 μm) superimposed over the 200 μm Ba2+ trace (red). Right, Simulated ramp currents derived from the Kir2 channel (black), Kleak channel (blue), and the sum (red) are superimposed.
Figure 5.
Figure 5.
Standing Kir2 and Kleak currents determine the resting membrane potential in PPNs. A, Control trace from PPN quiescent at rest in standard ACSF. B, After Ba2+ (200 μm) application, the cell depolarizes and begins to fire action potentials. C, The firing frequency stabilizes within 5–10 min after initiation of Ba2+ superfusion. D, Histogram of the interspike interval from C plotted against number of spikes (events) has a Gaussian distribution with a mode of 215 ± 1 ms. E, A plot of the interspike interval in order of occurrence shows that the stability in firing frequency persists over time. The data were fit with linear regression (black line) and had a slope of –0.01 and y-intercept at 250 ms.
Figure 6.
Figure 6.
Inwardly rectifying K+ channels in PPNs are attributable to Kir2.2, and Kir2.3 subunits that are present in the dendrites. Serial dilution experiments from pooled PrL/IL tissue showed that Kir2.1 (A), Kir2.2 (B), Kir2.3 (C), and Kir2.4 (D) subunit mRNAs are all expressed in this region. E, Individual cell representative of 30% of single cells profiled showing clear Kir2.1, Kir2.2, and Kir2.3 mRNA expression. Kir2.4 was rarely detected in individual cells. F, Graph of the detection frequency of Kir2 mRNA transcripts in 15 individual CaMKII-positive Prl/IL cells profiled shows consistent detection of Kir2.3 (100%) and Kir2.2 (64%), less detection of Kir2.1 (30%), and very little detection of Kir2.4 (7%). G, Immunocytochemistry shows dendritic colocalization of MAP2 with Kir2.2 protein (top row) and Kir2.3 protein (bottom row) in cultured cortical neurons. Scale bars, 30 μm.
Figure 7.
Figure 7.
Neuron simulations suggesting that Kir2 and Kleak channels are necessary for HCN-mediated sublinear summation of dendritic EPSPs. A, Current–voltage relationships for Kir2, Kleak, and HCN channels derived from voltage-clamp experiments. The sum of Kir2 and Kleak currents is shown as Ktotal. B, Dendritic HCN current density at the site of an excitatory synaptic input, positioned 75% of the way to the first branch point of the apical dendrite. At the bottom, the somatic EPSP resulting from the dendritic input is shown. Note the sublinear summation. Replacing the HCN channels with ohmic cation leak channels at a density that maintains the resting membrane potential results in more linear summation of EPSPs. Vertical scale bar, 50 mA/cm2. C, Top, Plot showing Kir2, Kleak, and HCN current densities at the dendritic site of synaptic contact. Bottom, The somatic EPSP displaying prominent sublinear summation. Note that Kir2 currents are reduced and Kleak currents are increased during the EPSP, resulting in little net change in outward current attributable to these K+ channels. HCN channels deactivate, producing a net outward change in current during the EPSP train. Vertical scale bar, 100 mA/cm2.
Figure 8.
Figure 8.
Simulations reducing Kir2 and Kleak channels mimic HCN blockade by reducing HCN activation. A, Reducing Kir2/Kleak channel density by 50% in the dendrites leads to membrane depolarization, deactivation of HCN channels, and greater summation of EPSPs. Top, Dendritic HCN current density is plotted at the synaptic site before and after reducing Kir2/Kleak density globally. Bottom, Somatic membrane potential is plotted before and after the Kir2/Kleak reduction. Note that the reduction in K+ currents leads to membrane depolarization, deactivation of HCN channels, and increased temporal summation of EPSPs. Subsequent reduction of HCN channel density by 50% (–HCN, –Kir2/Kleak trace) led to membrane hyperpolarization but little change in EPSP summation. This can be seen by aligning the somatic traces (bottom arrow). Vertical scale bar, 100 mA/cm2. B, Replacing Kir2 channels with Kleak channels leads to more pronounced sublinearity. Top, Kleak and HCN channel currents during synaptic stimulation. Note the prominent outward Kleak current evoked by the EPSPs. Bottom, Somatic voltage traces with the normal mix of Kir2 and Kleak channels (control) and with replacement of Kir2 channels (Kir2 → Kleak). Vertical scalebar, 50 mA/cm2. C, Replacing Kleak channels with Kir2 channels leads to greater EPSP summation. Top, Kir2 and HCN channel currents during synaptic stimulation. Note the net inward Kir2 current evoked by the EPSPs. Bottom, Somatic voltage traces with the normal mix of Kir2 and Kleak channels (control) and with replacement of Kleak channels (Kleak→ Kir2). Vertical scale bar, 50 mA/cm2. D, Ratio of the fifth EPSP in the train to the first as a function of simulation condition. Note that the ratio increases with Kir2/Kleak reduction and changes little with subsequent HCN block. Also, summation was more sublinear with dendrites containing only Kleak channels, and the increase in summation was less than with mixed channels.
Figure 9.
Figure 9.
Kir2 and Kleak K+-channel blockade occludes the effects of ZD-7288 on EPSP summation. A, Whole-cell current-clamp records (EPSPs) from a PPN during 40 Hz, 400 μA stimulation (black line) in the control condition (red trace), after partial Kir2/Kleak blockade after Ba2+ application (50 μm, blue trace). B, EPSPs during Kir2/Kleak block (blue trace in A) and both Kir2/Kleak and HCN blockade after ZD-7288 application (50 μm each, green trace). C, Voltage traces from A and B, normalized to the amplitude of the first EPSP in the train, show that the increase in temporal summation seen under conditions in which Kir2/Kleak channels are blocked is essentially unaltered after HCN channel blockade. D, Box plot of the ratio of the last to first EPSP in the train illustrates that the temporal summation seen under conditions in which Kir2/Kleak current is blocked (blue box) is not significantly increased with subsequent HCN channel blockade (green box), suggesting Kir2/Kleak currents are necessary to maintain HCN channel effects on synaptic integration (Mann–Whitney U test; p < 0.05; n = 4).

Similar articles

Cited by

References

    1. Akins P, Surmeier DJ, Kitai ST (1990) M1 muscarinic acetylcholine receptor in cultured rat neostriatum regulates phosphoinositide hydrolysis. J Neurochem 54: 266–273. - PubMed
    1. Benson DL, Isackson PJ, Gall CM, Jones EG (1992) Contrasting patterns in the localization of glutamic acid decarboxylase and Ca2+/calmodulin protein kinase gene expression in the rat central nervous system. Neuroscience 46: 825–849. - PubMed
    1. Berger T, Larkum ME, Luscher HR (2001) High I(h) channel density in the distal apical dendrite of layer V pyramidal cells increases bidirectional attenuation of EPSPs. J Neurophysiol 85: 855–868. - PubMed
    1. Chan CS, Shigemoto R, Mercer JN, Surmeier DJ (2004) HCN2 and HCN1 channels govern the regularity of autonomous pacemaking and synaptic resetting in globus pallidus neurons. J Neurosci 24: 9921–9932. - PMC - PubMed
    1. Chen S, Wang J, Siegelbaum SA (2001) Properties of hyperpolarization-activated pacemaker current defined by coassembly of HCN1 and HCN2 subunits and basal modulation by cyclic nucleotide. J Gen Physiol 117: 491–504. - PMC - PubMed

Publication types

MeSH terms

Substances

LinkOut - more resources