. 2005 Oct;73(10):6350-62.
doi: 10.1128/IAI.73.10.6350-6362.2005.

Specific antibody can prevent fungal biofilm formation and this effect correlates with protective efficacy

Affiliations

Specific antibody can prevent fungal biofilm formation and this effect correlates with protective efficacy

Luis R Martinez et al. Infect Immun. 2005 Oct.

Abstract

One of the most troublesome medical problems today is infection of prosthetic devices with organisms that form polysaccharide biofilms. This combined with increasing antimicrobial drug resistance is making many infectious diseases incurable. Cryptococcus neoformans is a human-pathogenic fungus that has a polysaccharide capsule and can form biofilms in prosthetic medical devices. We developed a system to study cryptococcal biofilm formation in vitro and studied the effect of antibody to the C. neoformans capsular polysaccharide on this process. C. neoformans biofilm formation was dependent on the presence of a polysaccharide capsule and correlated with the ability of capsular polysaccharide to bind the polystyrene solid support. Protective antibodies prevented biofilm formation whereas nonprotective antibodies were not effective. The mechanism of antibody action involved interference with capsular polysaccharide release from the fungal cell. In contrast, lactoferrin, an effector molecule of innate immune mechanisms, was unable to prevent fungal biofilm formation despite its efficacy against bacterial biofilms. Our results suggest a new role of adaptive humoral immunity whereby some antibodies can inhibit biofilm formation by encapsulated organisms. Vaccines that elicit antibody responses to capsular antigens and/or passive transfer of antibodies to microbial polysaccharides may be useful in preventing biofilm formation.


Figures
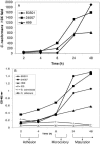
FIG. 1.
FIG. 1.
A. C. neoformans forms biofilm in vitro. Kinetics of C. neoformans biofilm formation was determined by cell counts. Results are representative of two experiments. B. The kinetics of C. neoformans biofilm formation was compared to that of other fungi, and fungal mass was determined by XTT reduction assay. The points denote the average measurements. This experiment was done several times with similar results.
FIG. 2.
FIG. 2.
Light microscopy images of C. neoformans B3501 biofilms after forceful washing using a microtiter plate washer. A and B. Adhesion phase (2 to 4 h). The cryptococcal cells adhere to the bottom of the wells. At this stage the biofilm consists of cells undergoing budding or fungal growth in a monolayer fashion. C and D. Intermediate phase (8 to 16 h). After attachment of the cryptococcal cells to the polystyrene plate, fungal growth involves microcolony formation consisting of cells grouped in clusters. E and F. Maturation phase (24 to 48 h). A dense network of yeast cells bound to each other is formed by a combination of capsular polysaccharide fibers and extracellular material, creating a tenacious layer consisting of cells enmeshed in polysaccharide matrix. At this point the thickness of the biofilm consists of several layers of cells. Pictures were taken using a 20-power field. The scale bar applies to all panels.
FIG. 3.
FIG. 3.
Scanning electron microscopy image of mature (48-h) C. neoformans B3501 biofilms formed on glass coverslips revealed that cryptococcal cells are internally connected by copious amounts of polysaccharide. Arrows denote polysaccharide. Bar, 5 μm.
FIG. 4.
FIG. 4.
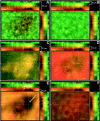
CM images of a mature C. neoformans biofilm grown on polystyrene plates reveal a highly organized architecture. Orthogonal images of mature C. neoformans biofilms showed metabolically active (red, FUN-1-stained) cells embedded in the polysaccharide extracellular material (green, ConA stained). A. Mature C. neoformans biofilm showed a complex structure with internal regions of metabolically active cells interwoven with extracellular polysaccharide material. The thickness of a mature biofilm is approximately 55 μm. B. C. neoformans cells in mature biofilms were encased in exopolymeric matrix (green stained) and appeared to be approximately 28 μm thick. C. Interface of mature biofilm that separates the locations of highly metabolically active yeast cells and exopolymeric matrix. The thickness is approximately 27 μm from its starting point to the bottom of the biofilm. D. Fluorescence red-stained region within biofilm revealed the areas where most metabolically active cryptococcal cells are located. This region is approximately 13 μm thick. E. A flowing channel appears as a dark patch in the C. neoformans biofilm. This channel is approximately 69 μm in length and 43 μm in width and is mainly surrounded by dual-stained (yellow) yeast cells. Arrows denote the location of the channel in the mature cryptococcal biofilm. F. The bottom of a C. neoformans biofilm consisted of mainly dual-stained cryptococcal cells and scattered porous regions. Pictures were taken using a 40-power field. Bar, 50 μm.
FIG. 5.
FIG. 5.
C. neoformans polysaccharide capsule is an essential structural component of the biofilms. The kinetics of C. neoformans B3501 biofilm formation was compared with those of its capsule mutant (C536) and complemented strains (C538). This experiment was done twice with similar results.
FIG. 6.
FIG. 6.
Binding of serotype A, B, or D capsular polysaccharide to the plastic surface of a microtiter plate. Serotype D strain capsular polysaccharide of C. neoformans attached best to the polystyrene microtiter plate. The inset diagram indicates the ELISA configuration used to detect the polysaccharide bound to the bottom of the plate. AP, alkaline phosphatase.
FIG. 7.
FIG. 7.
A. Graphic representation of the ELISA spot configuration. The diagram indicates the antibodies (MAb 18B7 and goat anti-mouse [GAM] IgG1 conjugated to biotin) used to recognize the GXM released by C. neoformans (Cn) cells to the bottom of the plate. B. Light microscopic images of spots formed by C. neoformans strains 24067, B3501, and H99 during ELISA spot assay. Images were obtained after 30 min and 1, 2, and 3 h of incubation in polystyrene microtiter plates. Bars, 50 μm. Results are representative of two experiments. C. Spot number in microtiter wells as a function of time for three biofilm-forming strains of C. neoformans. Bars are the average numbers of spots in five power fields, and error bars denote standard deviations. Pictures were taken using a 20-power field. D. Spot area as a function of time for three biofilm-forming strains. GXM amount was visualized by ELISA spot assay. Bars are the averages of the areas of 20 spots per power field with the area being calculated as = πr2. Five power fields were observed per time interval. Error bars denote standard deviations. Pictures were taken using a 20-power field.
FIG. 7.
FIG. 7.
A. Graphic representation of the ELISA spot configuration. The diagram indicates the antibodies (MAb 18B7 and goat anti-mouse [GAM] IgG1 conjugated to biotin) used to recognize the GXM released by C. neoformans (Cn) cells to the bottom of the plate. B. Light microscopic images of spots formed by C. neoformans strains 24067, B3501, and H99 during ELISA spot assay. Images were obtained after 30 min and 1, 2, and 3 h of incubation in polystyrene microtiter plates. Bars, 50 μm. Results are representative of two experiments. C. Spot number in microtiter wells as a function of time for three biofilm-forming strains of C. neoformans. Bars are the average numbers of spots in five power fields, and error bars denote standard deviations. Pictures were taken using a 20-power field. D. Spot area as a function of time for three biofilm-forming strains. GXM amount was visualized by ELISA spot assay. Bars are the averages of the areas of 20 spots per power field with the area being calculated as = πr2. Five power fields were observed per time interval. Error bars denote standard deviations. Pictures were taken using a 20-power field.
FIG. 8.
FIG. 8.
A. C. neoformans biofilm formation is inhibited by the presence of IgG1 MAb 18B7, which binds GXM. The inset graph indicates the metabolic activity of C. neoformans B3501, 24067, and H99 cells grown in the presence or absence of MAb. The absence of differences indicates that specific antibody has no effect on fungal growth. Bars are the averages of three measurements, and error bars denote standard deviations. Asterisks denote P value significance calculated by analysis of variance and adjusted by the Bonferroni correction. B. MAb 18B7 prevents C. neoformans B3501 biofilm formation by interference with capsular polysaccharide release. Light microscopic images of spots formed by C. neoformans B3501during ELISA spot assay. Images were obtained after 2 h of incubation of fungal cells in the absence and presence of GXM binding MAb 18B7 or irrelevant antibody 3671 in a polystyrene microtiter plates. Results are representative of two experiments. Inset is a graphic representation of the ELISA spot configuration utilized. The diagram indicates the antibodies (MAb 2D10 and goat anti-mouse [GAM] IgM conjugated to biotin) used to recognize the GXM released by C. neoformans (Cn) cells to the bottom of the plate.
FIG. 8.
FIG. 8.
A. C. neoformans biofilm formation is inhibited by the presence of IgG1 MAb 18B7, which binds GXM. The inset graph indicates the metabolic activity of C. neoformans B3501, 24067, and H99 cells grown in the presence or absence of MAb. The absence of differences indicates that specific antibody has no effect on fungal growth. Bars are the averages of three measurements, and error bars denote standard deviations. Asterisks denote P value significance calculated by analysis of variance and adjusted by the Bonferroni correction. B. MAb 18B7 prevents C. neoformans B3501 biofilm formation by interference with capsular polysaccharide release. Light microscopic images of spots formed by C. neoformans B3501during ELISA spot assay. Images were obtained after 2 h of incubation of fungal cells in the absence and presence of GXM binding MAb 18B7 or irrelevant antibody 3671 in a polystyrene microtiter plates. Results are representative of two experiments. Inset is a graphic representation of the ELISA spot configuration utilized. The diagram indicates the antibodies (MAb 2D10 and goat anti-mouse [GAM] IgM conjugated to biotin) used to recognize the GXM released by C. neoformans (Cn) cells to the bottom of the plate.
FIG. 9.
FIG. 9.
Specific IgM MAb 12A1 significantly inhibits C. neoformans B3501 strain biofilm production. Bars are the averages of three measurements, and error bars denote standard deviations. Asterisks denote P value significance calculated by analysis of variance and adjusted by the Bonferroni correction. These experiments were done twice with similar results.
FIG. 10.
FIG. 10.
C. neoformans biofilm formation is not inhibited by the presence of lactoferrin. Bars are the averages of three measurements, and error bars denote standard deviations. These experiments were done twice with similar results.
FIG. 11.
FIG. 11.
Model of antibody-mediated inhibition of C. neoformans biofilm formation. In the absence of MAb, C. neoformans cells release capsular polysaccharide which is involved in attachment to the plastic surface. In the presence of a MAb specific to C. neoformans polysaccharide capsule the immunoglobulin prevents capsular polysaccharide release, which blocks the adhesion of the yeast cells to the surface.

Similar articles

Cited by

References

    1. Bullitt, R., and L. Makowski. 1995. Structural polymorphism of bacterial adhesion pili. Nature 373:164-167. - PubMed
    1. Casadevall, A., W. Cleare, M. Feldmesser, A. Glatman-Freedman, D. L. Goldman, T. R. Kozel, N. Lendvai, J. Mukherjee, L. A. Pirofski, J. Rivera, A. L. Rosas, M. D. Scharff, P. Valadon, K. Westin, and Z. Zhong. 1998. Characterization of a murine monoclonal antibody to Cryptococcus neoformans polysaccharide that is a candidate for human therapeutic studies. Antimicrob. Agents Chemother. 42:1437-1446. - PMC - PubMed
    1. Casadevall, A., J. Mukherjee, and M. D. Scharff. 1992. Monoclonal antibody based ELISAs for cryptococcal polysaccharide. J. Immunol. Methods 154:27-35. - PubMed
    1. Casadevall, A., and L. Pirofski. 2003. Antibody-mediated regulation of cellular immunity and the inflammatory response. Trends Immunol. 24:474-478. - PubMed
    1. Casadevall, A., and M. D. Scharff. 1991. The mouse antibody response to infection with Cryptococcus neoformans: VH and VL usage in polysaccharide binding antibodies. J. Exp. Med. 174:151-160. - PMC - PubMed

Publication types

MeSH terms

LinkOut - more resources