

Tomographic bioluminescence imaging by use of a combined optical-PET (OPET) system: a computer simulation feasibility study
- PMID: 16177541
- PMCID: PMC1317109
- DOI: 10.1088/0031-9155/50/17/021
Tomographic bioluminescence imaging by use of a combined optical-PET (OPET) system: a computer simulation feasibility study
Abstract
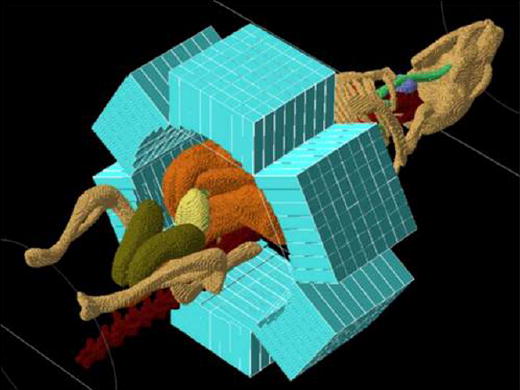
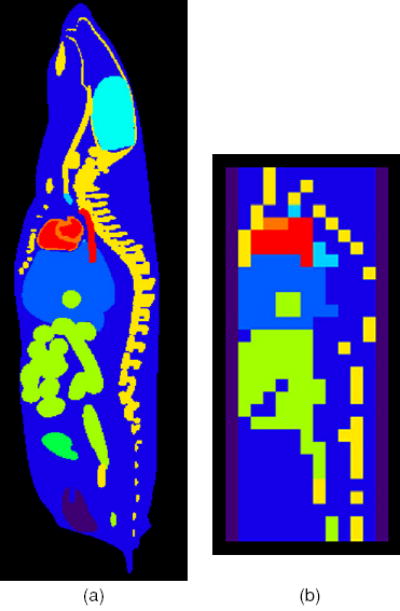
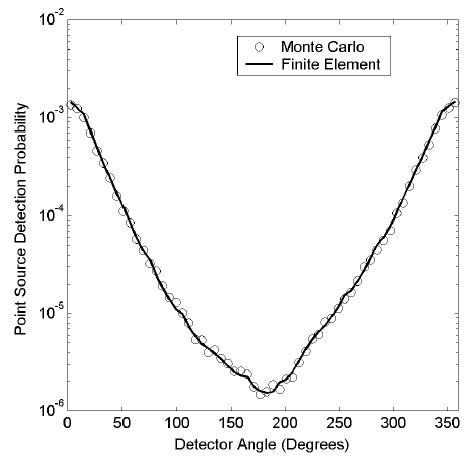
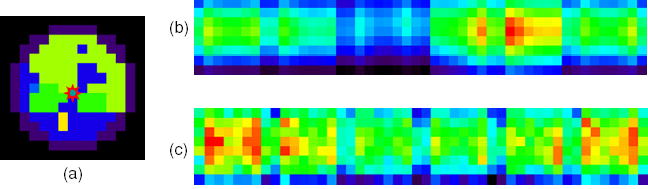
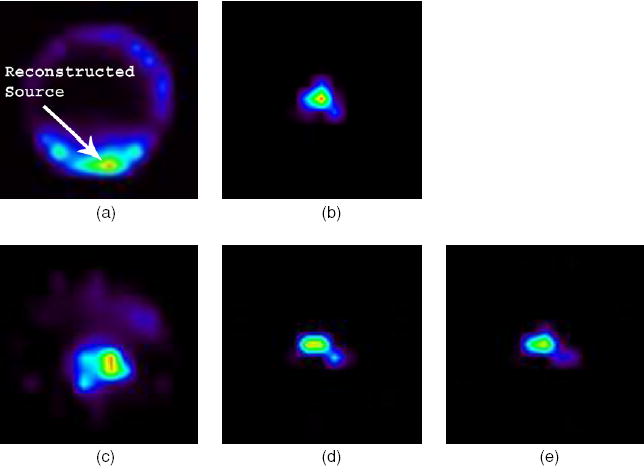
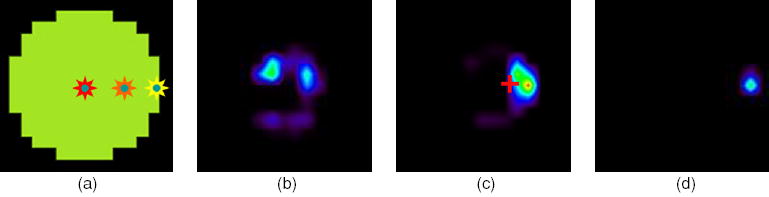
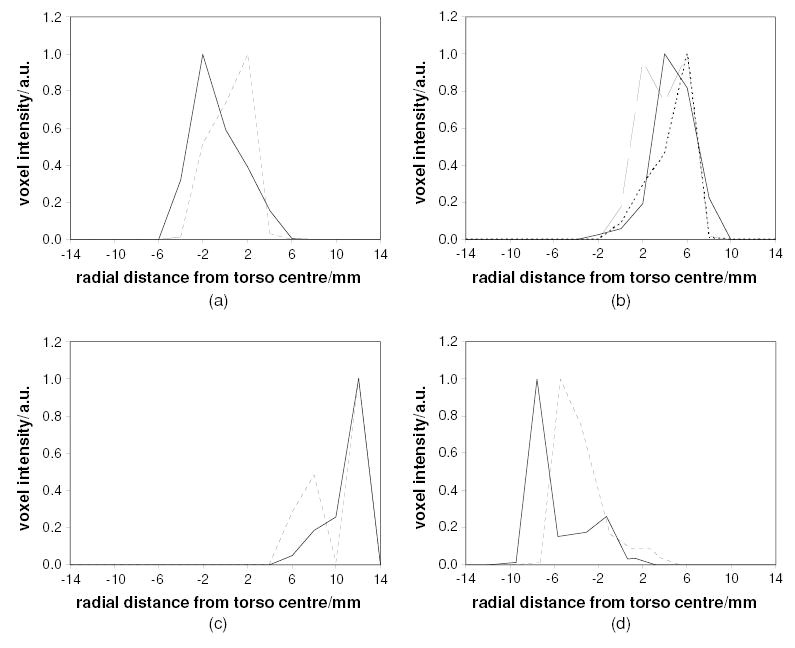
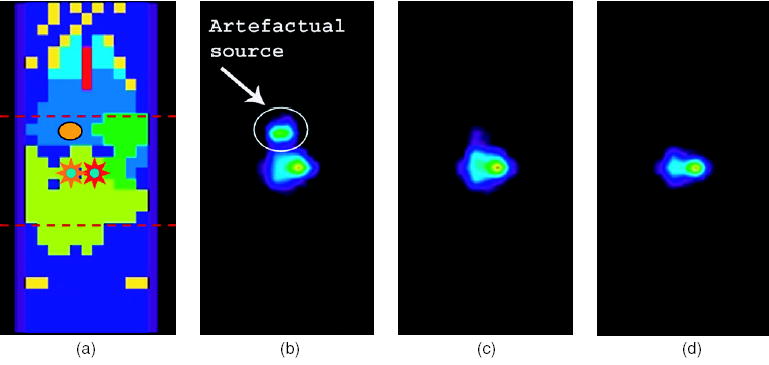
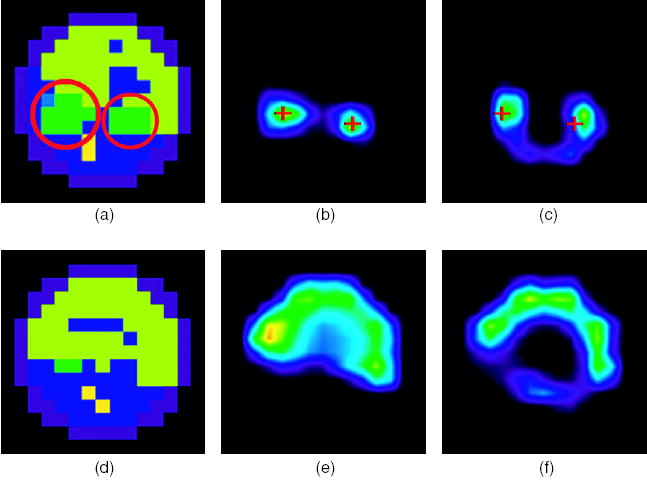
The feasibility and limits in performing tomographic bioluminescence imaging with a combined optical-PET (OPET) system were explored by simulating its image formation process. A micro-MRI based virtual mouse phantom was assigned appropriate tissue optical properties to each of its segmented internal organs at wavelengths spanning the emission spectrum of the firefly luciferase at 37 degrees C. The TOAST finite-element code was employed to simulate the diffuse transport of photons emitted from bioluminescence sources in the mouse. OPET measurements were simulated for single-point, two-point and distributed bioluminescence sources located in different organs such as the liver, the kidneys and the gut. An expectation maximization code was employed to recover the intensity and location of these simulated sources. It was found that spectrally resolved measurements were necessary in order to perform tomographic bioluminescence imaging. The true location of emission sources could be recovered if the mouse background optical properties were known a priori. The assumption of a homogeneous optical property background proved inadequate for describing photon transport in optically heterogeneous tissues and led to inaccurate source localization in the reconstructed images. The simulation results pointed out specific methodological challenges that need to be addressed before a practical implementation of OPET-based bioluminescence tomography is achieved.
Figures
Similar articles
-
Effect of optical property estimation accuracy on tomographic bioluminescence imaging: simulation of a combined optical-PET (OPET) system.Phys Med Biol. 2006 Apr 21;51(8):2045-53. doi: 10.1088/0031-9155/51/8/006. Epub 2006 Apr 3. Phys Med Biol. 2006. PMID: 16585844 Free PMC article.
-
Spectrally resolved bioluminescence tomography with adaptive finite element analysis: methodology and simulation.Phys Med Biol. 2007 Aug 7;52(15):4497-512. doi: 10.1088/0031-9155/52/15/009. Epub 2007 Jul 3. Phys Med Biol. 2007. PMID: 17634646
-
Boundary integral method for bioluminescence tomography.J Biomed Opt. 2006 Mar-Apr;11(2):020503. doi: 10.1117/1.2191790. J Biomed Opt. 2006. PMID: 16674174
-
Optical tomographic imaging of small animals.Curr Opin Biotechnol. 2005 Feb;16(1):79-88. doi: 10.1016/j.copbio.2005.01.002. Curr Opin Biotechnol. 2005. PMID: 15722019 Review.
-
Hierarchical clustering method to improve transrectal ultrasound-guided diffuse optical tomography for prostate cancer imaging.Acad Radiol. 2014 Feb;21(2):250-62. doi: 10.1016/j.acra.2013.11.003. Acad Radiol. 2014. PMID: 24439338 Free PMC article. Review.
Cited by
-
Optimization of optical excitation of upconversion nanoparticles for rapid microscopy and deeper tissue imaging with higher quantum yield.Theranostics. 2013 Mar 23;3(5):306-16. doi: 10.7150/thno.6007. Print 2013. Theranostics. 2013. PMID: 23650478 Free PMC article.
-
Optimization of the Energy Window for PETbox4, a Preclinical PET Tomograph With a Small Inner Diameter.IEEE Trans Nucl Sci. 2014 Jun 1;61(3):1164-1173. doi: 10.1109/TNS.2014.2321326. IEEE Trans Nucl Sci. 2014. PMID: 25774063 Free PMC article.
-
Quantitative Cherenkov emission spectroscopy for tissue oxygenation assessment.Opt Express. 2012 Feb 27;20(5):5133-42. doi: 10.1364/OE.20.005133. Opt Express. 2012. PMID: 22418319 Free PMC article.
-
A Finite Element Mesh Regrouping Strategy-Based Hybrid Light Transport Model for Enhancing the Efficiency and Accuracy of XLCT.Front Oncol. 2022 Jan 17;11:751139. doi: 10.3389/fonc.2021.751139. eCollection 2021. Front Oncol. 2022. PMID: 35111664 Free PMC article.
-
Illumination pattern optimization for fluorescence tomography: theory and simulation studies.Phys Med Biol. 2010 May 21;55(10):2961-82. doi: 10.1088/0031-9155/55/10/011. Epub 2010 Apr 30. Phys Med Biol. 2010. PMID: 20436232 Free PMC article.
References
-
- Arridge SR, Schweiger M, Hiraoka M, Delpy DT. A finite element approach for modeling photon transport in tissue. 1993;20:299–309. - PubMed
-
- Barnett AH, Culver JP, Sorensen AG, Dale A, Boas DA. Robust inference of baseline optical properties of the human head with three-dimensional segmentation from magnetic resonance imaging. Appl Opt. 2003;42:3095–108. - PubMed
-
- Beek JF, Blokland P, Posthumus P, Aalders M, Pickering JW, Sterenborg HJCM, vanGemert MJC. In vitro double-integrating-sphere optical properties of tissues between 630 and 1064 nm. Phys Med Biol. 1997a;42:2255–61. - PubMed
-
- Beek JF, vanStaveren HJ, Posthumus P, Sterenborg HJCM, vanGemert MJC. The optical properties of lung as a function of respiration. Phys Med Biol. 1997b;42:2263–72. - PubMed
-
- Boas DA, Culver JP, Stott JJ, Dunn AK. Three dimensional Monte Carlo code for photon migration through complex heterogeneous media including the adult human head. Opt Express. 2002;10:159–70. - PubMed
Publication types
MeSH terms
Grants and funding
LinkOut - more resources
Full Text Sources
Other Literature Sources