. 2005 Oct 19;24(20):3555-64.
doi: 10.1038/sj.emboj.7600810. Epub 2005 Sep 22.

Transcriptional repressor DREAM regulates T-lymphocyte proliferation and cytokine gene expression

Affiliations

Transcriptional repressor DREAM regulates T-lymphocyte proliferation and cytokine gene expression

Magali Savignac et al. EMBO J. .

Abstract

Downstream Regulatory Element Antagonist Modulator (DREAM) is a Ca2+-dependent transcriptional repressor expressed in the brain, thyroid gland and thymus. Here, we analyzed the function of DREAM and the related protein KChIP-2 in the immune system using transgenic (tg) mice expressing a cross-dominant active mutant (EFmDREAM) for DREAM and KChIPs Ca2+-dependent transcriptional derepression. EFmDREAM tg mice showed reduced T-cell proliferation. Tg T cells exhibited decreased interleukin (IL)-2, -4 and interferon (IFN)gamma production after polyclonal activation and following antigen-specific response. Chromatin immunoprecipitation and transfection assays showed that DREAM binds to and represses transcription from these cytokine promoters. Importantly, specific transient knockdown of DREAM or KChIP-2 induced basal expression of IL-2 and IFNgamma in wild-type splenocytes. These data propose DREAM and KChIP-2 as Ca2+-dependent repressors of the immune response.


Figures

Figure 1
Figure 1
DREAM expression is downregulated after stimulation in lymphoid cells. (A) Quantitative real-time RT–PCR analysis of DREAM and KChIP-2 mRNA levels in thymocytes, splenocytes and purified T, CD4+ and CD8+ cells. Results are representative of two experiments. (B) DREAM mRNA levels in thymocytes or splenocytes at different times after stimulation with αCD3 (4 μg/ml). Results are expressed as fold induction compared to nonstimulated cells and are representative of four experiments.
Figure 2
Figure 2
EFmDREAM interacts with DREAM and KChIP-2 and blocks Ca2+-mediated derepression. (A) Yeast two-hybrid assay showing the specific interactions between EFmDREAM and DREAM or KChIP-2. pAS2-1 is the empty vector used as control. Use of low (DDO) or high (QDO) selective medium is indicated. (B) Coimmunoprecipitation analysis of Flag–DREAM and Myc–KChIP-2 after transient transfection in HeLa cells. (C) Repression of the DRE-containing pHD3CAT reporter by DREAM, KChIP-2, EFmDREAM or the combinations of EFmDREAM with DREAM or KChIP-2 (in a 1:3 ratio) after transient cotransfection in HEK293 cells. Treatment with caffeine was started 6 h before harvesting the cells. Results are the mean±s.d. of triplicates and are representative of three independent experiments.
Figure 3
Figure 3
The T-cell proliferative response is impaired in EFmDREAM tg mice. (A) Quantitative real-time RT–PCR analysis of the expression of EFmDREAM in the thymus and spleen of trangenic mice from lines 1 and 33. Results are the mean±s.d. of 4–8 mice. (B) Flow-cytometric analysis of cells from thymus and spleen. Single-cell suspensions were stained with the indicated antibody combination. Positive cells (%) within a quadrant are indicated. The results are representative of six wt and six tg mice. (C) Cell proliferation was quantified in wt and tg thymocytes stimulated with the indicated amount of plate-bound αCD3 alone or αCD3 (6 μg/ml) in combination with αCD28 for 48 h. Results are the mean±s.d. of four mice per group and are representative of three independent experiments. (D) Cell proliferation was analyzed in wt and tg thymocytes 48 h after stimulation with plate-bound αCD3 (6 μg/ml) in the presence or absence of recombinant murine IL-2 (20 ng/ml). Results are the mean±s.d. of four mice per group and are representative of two independent experiments. Asterisks represent the statistical significance versus the appropriate control in each case. *P<0.05, **P<0.01 and ***P<0.001.
Figure 4
Figure 4
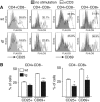
Reduced expression of activation markers in tg T cells. (A, B) Thymocytes were stimulated with plate-bound αCD3 (6 μg/ml) and analyzed by cytometry for CD25, CD69, CD4 and CD8 expression after 24 h. (A) shows a representative example and (B) shows the %±s.d. of CD25+ and CD69+ cells of the gated CD4+CD8− (left panel) or of the gated CD4−CD8+ (right panel) after stimulation of four mice per group. Asterisks represent statistical significance versus the appropriate control in each case. *P<0.05 and ***P<0.001.
Figure 5
Figure 5
Decreased IL-2 and IFNγ protein in tg T cells. Thymocytes (A, B) or CD4+ T (C, D) from wt and tg mice were stimulated for 48 h with different concentrations of αCD3. Levels of IL-2 (A, C) or IFNγ (B, D) were quantified by ELISA. In (A, B), results are the mean±s.d. of five mice per group and are representative of four independent experiments. In (C, D), results are the mean±s.d. of triplicates and are representative of two experiments. (E, F) CD4+ T cells from wt and EFmDREAM mice were cultured under Th1 or Th2 differentiating conditions for 2 weeks and cytokine levels analyzed. Results are representative of three experiments. Asterisks represent statistical significance versus the appropriate control in each case *P<0.05, **P<0.01 and ***P<0.001.
Figure 6
Figure 6
EFmDREAM decreases cytokine production following antigen-specific stimulation. Wt and tg mice were immunized s.c. with 50 μg of OVA in CFA. Draining lymph node cells were harvested 9 days later and cultured in the presence of the indicated concentration of OVA. (A) IL-2, (B) IFNγ secretion and (C) antigen-induced proliferation were quantified after 48 h. Data are expressed as mean±s.d. of five mice per group. Results are representative of two experiments. Asterisks represent statistical significance versus the appropriate control in each case. *P<0.05, **P<0.01 and ***P<0.001.
Figure 7
Figure 7
DREAM regulates the transcriptional activity of IL-2, -4 and IFNγ promoters in vivo. (A) Putative DRE sites present in IL-2, IFNγ and IL-4 regulatory regions. Arrows indicate the orientation of the DRE sequence. (B) EMSA using extracts from wt thymocytes and the DREIL-2 probe. Competitions with DREIL-2, DREDyn and SP1 are shown. The arrow indicates the specific DRE retarded band eliminated by preincubation with αDREAM (Ab1014). The asterisks mark the appearance of nonspecific bands after serum incubation. (C) EMSA using extracts from HEK293 cells transiently transfected with DREAM or KChIP-2 and the DREIL-2 probe. The arrow indicates the specific retarded band that is competed with Ca2+. (D) DRE-dependent DREAM repression of IL-2, -4 and IFNγ promoters. Plasmid pRL-CMV was used to correct for transfection efficiency. The transfection experiments were repeated twice in quadruplicates. Asterisks represent statistical significance versus the appropriate control in each case. *P<0.05 and ***P<0.001. (E) ChIP using tg thymocytes or (F) Jurkat cells nonstimulated cells (−) or cells after 2 h of PMA/Iono stimulation (+).
Figure 8
Figure 8
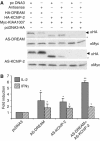
Specific transient knockdown of DREAM or KChIP-2 induces cytokine expression in splenocytes. (A) Western blot analysis of HEK293 cells transiently cotransfected with AS-DREAM or AS-KChIP-2 together with HA-DREAM or HA-KChIP-2 and Myc-KIAA1007 (loading control). The upper panel shows the specific knockdown of the HA-DREAM protein by AS-DREAM (arrowhead), and the lack of effect on HA-KChIP-2 (asterisk) or Myc-KIAA1007. The lower panel shows the specific knockdown of the HA-KChIP-2 protein by AS-KChIP-2 (asterisk) and the lack of effect on HA-DREAM (arrowhead) or Myc-KIAA1007. (B) Quantitative analysis of IL-2 and IFNγ mRNA expression by real-time quantitative RT–PCR in splenocytes from wt mice 48 h following electroporation with empty vector pcDNA3, AS-DREAM or AS-KChIP-2 or both. Results are expressed as fold induction compared to cells transfected with pcDNA3, and are the mean±s.d. from two experiments in triplicates. Asterisks represent statistical significance versus the appropriate control in each case. *P<0.05 and **P<0.01.

Similar articles

Cited by

References

    1. An WF, Bowlby MR, Betty M, Cao J, Ling HP, Mendoza G, Hinson JW, Mattsson KI, Strassle BW, Trimmer JS, Rhodes KJ (2000) Modulation of A-type potassium channels by a family of Ca2+ sensors. Nature 403: 553–556 - PubMed
    1. Argyropoulos C, Nikiforidis GC, Theodoropoulou M, Adamopoulos P, Boubali S, Georgakopoulos TN, Paliogianni F, Papavassiliou AG, Mouzaki A (2004) Mining microarray data to identify transcription factors expressed in naive resting but not activated T lymphocytes. Genes Immun 5: 16–25 - PubMed
    1. Benedito AB, Lehtinen M, Massol R, Lopes UG, Kirchhausen T, Rao A, Bonni A (2005) The transcription factor NFAT3 mediates neuronal survival. J Biol Chem 280: 2818–2825 - PubMed
    1. Buckley AF, Kuo CT, Leiden JM (2001) Transcription factor LKLF is sufficient to program T cell quiescence via a c-Myc-dependent pathway. Nat Immunol 2: 698–704 - PubMed
    1. Buxbaum JD, Choi EK, Luo Y, Lilliehook C, Crowley AC, Merriam DE, Wasco W (1998) Calsenilin: a Ca2+-binding protein that interacts with the presenilins and regulates the levels of a presenilin fragment. Nat Med 4: 1177–1181 - PubMed

Publication types

MeSH terms