. 2005 Oct;142(1):21-30.
doi: 10.1111/j.1365-2249.2005.02894.x.

The disease progression in the keratin 14 IL-4-transgenic mouse model of atopic dermatitis parallels the up-regulation of B cell activation molecules, proliferation and surface and serum IgE

Affiliations

The disease progression in the keratin 14 IL-4-transgenic mouse model of atopic dermatitis parallels the up-regulation of B cell activation molecules, proliferation and surface and serum IgE

L Chen et al. Clin Exp Immunol. 2005 Oct.

Abstract

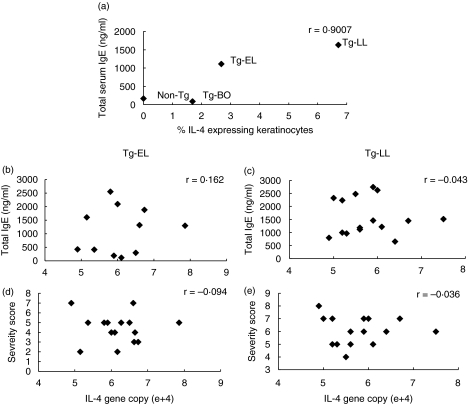
We have previously characterized the keratin 14 interleukin-4-transgenic (IL-4-Tg) mouse model of atopic dermatitis as a chronic pruritic inflammatory skin disease typified by skin infiltration of inflammatory cells and early up-regulation of Th2 cytokines and late surge of Th1 cytokines. In the present study, we examined the involvement of B cells. Systematic examinations of the following immunological parameters on B cells were carried out in non-Tg control mice and in IL-4-Tg mice at before disease onset and early and late disease stages so that we could determine the immunological sequence of events leading to the disease development: surface expressions of IA/IE, activation and costimulatory molecules, proliferation under LPS or IgM stimulation, quantification of cell surface and serum IgE, IgG1, and IgG2a. Our results showed that as the disease progresses from before onset to early disease and to late disease, there is a parallel increase in surface markers of B cell activation (IA/IE, CD44, CD69, CD80 and CD86), in B cell proliferation, and in cell surface and serum IgE. Significant increases of Th2-driven serum IgG1 and IgE in early disease was followed by significant increase of Th1-driven IgG2a in late disease. Importantly the significant increases of activation molecule (IA/IE), proliferation (to LPS), and surface IgE on B cells of the IL-4-Tg mice precedes the up-regulation of serum IgE and disease onset. These data suggest that activated B cells may play a role in atopic dermatitis disease development by up-regulating serum IgE concentration, which serves as a marker of disease onset.


Figures

Fig. 4
Fig. 4
Total serum concentrations of IgE, IgG1and IgG2a are elevated as the disease develops. Serum samples from non-Tg, Tg-BO, Tg-EL and Tg-LL mice were examined for total IgE levels (n = 15; a), and IgG1/IgG2a (n = 10; b & c) by ELISA as described in Materials and Methods. Data are expressed as mean ± SD. *Statistical significance versus non-Tg mice; ♯statistical significance versus Tg-BO mice.
Fig. 1
Fig. 1
B cell percentage and total number increase in the LNs but decrease in the spleen of the diseased mice while they are activated as the disease progresses. The LNs and spleens were collected from non-Tg, Tg-BO, Tg-EL and Tg-LL mice. Single cell suspension was incubated with FITC anti-CD19 and PE antibodies to CD44 (c), CD69 (d), CD80 (e), CD86 (f), or FITC anti-IA/IE MHC class II and PE anti-CD19 (g), followed by analyses by flow cytometry. MFI was obtained from IA/IE histograms gated on CD19+ cells. Frequencies and absolute numbers of CD19+ cells in the LNs and spleen are expressed as mean ± SD and were the summary of three to four experiments. *Statistical significance versus non-Tg mice; ♯statistical significance versus Tg-BO mice. SP: spleen; Ave: average percentages of the LNs and spleen CD19+ B cells; Com: combined absolute numbers of the LNs and spleen CD19+ B cells.
Fig. 2
Fig. 2
B cells from diseased Tg mice have strong proliferation against stimuli of LPS and anti-IgM. Isolated B cells from LNs of non-Tg, Tg-BO, Tg-EL and Tg-LL mice in triplicate were incubated in the presence or absence of 50 µg/ml LPS or 50 µg/ml anti-mouse IgM antibody for 72 h, and then the cell proliferation rate was examined as described in Materials and Methods. Results are expressed as the mean ± SD of triplicate cultures. This is a representative of three separate experiments.
Fig. 3
Fig. 3
Surface IgE, IgG1 and IgG2a on B cells are significantly increased in the diseased mice. LNs were collected from non-Tg, Tg-BO, Tg-EL and Tg-LL mice. Single cell suspension from each group was labelled with FITC anti-CD19 and PE anti-IgE/IgG1/IgG2a without permeabilization and then proceeded to flow cytometric analysis. (a) Representative dot plots of IgE on CD19+ B cell in non-Tg, Tg-BO, Tg-EL and Tg-LL mice. (b) Summary of B cell surface IgE, IgG1 and IgG2a averaged from three experiments and data are expressed as mean ± SD. *Statistical significance versus non-Tg mice; #statistical significance versus Tg-BO.
Fig. 5
Fig. 5
Total serum IgE correlates with percentage increase in IL-4-expressing keratinocytes as the disease progresses. Serum IgE levels determined by ELISA were correlated with either the IL-4-expressing keratinocytes (a) or with the IL-4 transgene genomic DNA copy numbers determined by quantitative real time PCR (b, c), which were also correlated with scores of the disease severity determined by the number of location of skin involved, and the presence of inflammation (d, e). (a) Positive correlation between total serum IgE level and IL-4-expressing keratinocytes. (b, c) No correlation between total serum IgE level and IL-4 transgene genomic DNA copy numbers in the skin from EL and LL mice (d, e): No correlation between severity scores and IL-4 transgene genomic DNA copy numbers in the skin from EL and LL mice. The means of total serum IgE concentrations in each group are used in Fig. 5a.
Fig. 6
Fig. 6
Progressively increased expression of IL-4 in LNs as the disease develops. Total RNAs collected from LNs of non-Tg, Tg-BO, Tg-EL and Tg-LL mice were reversely transcribed and the IL-4 cDNA copy numbers were determined by quantitative real time PCR. Experimental data are expressed as mean ± SD (n = 5 in each group). *Statistical significance versus non-Tg, Tg-BO or Tg-EL.

Similar articles

Cited by

References

    1. Kallstrom E, Roscher I, Andreasson A, Back O, van Hage-Hamsten M. Decreased frequency of intracellular IFN-gamma producing T cells in whole blood preparations from patients with atopic dermatitis. Exp Dermatol. 2002;11:556–63. - PubMed
    1. Jones HE, Inouye JC, McGerity JL, Lewis CW. Atopic disease and serum immunoglobulin-E. Br J Dermatol. 1975;92:17–25. - PubMed
    1. Jones HE, Wade TR. Relationship between atopic dermatitis and immunoglobulin E. Int J Dermatol. 1976;15:293–6. - PubMed
    1. Ohman S, Johansson SG. Immunoglobulins in atopic dermatitis with special reference to IgE. Acta Derm Venereol. 1974;54:193–202. - PubMed
    1. Novak N, Kraft S, Bieber T. Unraveling the mission of FcepsilonRI on antigen-presenting cells. J Allergy Clin Immunol. 2003;111:38–44. - PubMed

Publication types

MeSH terms