. 2005 Dec 1;569(Pt 2):519-31.
doi: 10.1113/jphysiol.2005.097642. Epub 2005 Sep 22.

Activation of KATP channels by H2S in rat insulin-secreting cells and the underlying mechanisms

Affiliations

Activation of KATP channels by H2S in rat insulin-secreting cells and the underlying mechanisms

Wei Yang et al. J Physiol. .

Abstract

H2S is an important gasotransmitter, generated in mammalian cells from L-cysteine metabolism. As it stimulates K(ATP) channels in vascular smooth muscle cells, H2S may also function as an endogenous opener of K(ATP) channels in INS-1E cells, an insulin-secreting cell line. In the present study, K(ATP) channel currents in INS-1E cells were recorded using the whole-cell and single-channel recording configurations of the patch-clamp technique. K(ATP) channels in INS-1E cells have a single-channel conductance of 78 pS. These channels were activated by diazoxide and inhibited by gliclazide. ATP (3 mm) in the pipette solution inhibited K(ATP) channels in INS-1E cells. Significant amount of H2S was produced from INS-1E cells in which the expression of cystathinonie gamma-lyase (CSE) was confirmed. After INS-1E cells were transfected with CSE-targeted short interfering RNA (CSE-siRNA) or treated with DL-propargylglycine (PPG; 1-5 mm) to inhibit CSE, endogenous production of H2S was abolished. Increase in extracellular glucose concentration significantly decreased endogenous production of H2S in INS-1E cells, and increased insulin secretion. After transfection of INS-1E cells with adenovirus containing the CSE gene (Ad-CSE) to overexpress CSE, high glucose-stimulated insulin secretion was virtually abolished. Basal K(ATP) channel currents were significantly reduced after incubating INS-1E cells with a high glucose concentration (16 mm) or lowering endogenous H2S level by CSE-siRNA transfection. Under these conditions, exogenously applied H2S significantly increased whole-cell K(ATP) channel currents at concentrations equal to or lower than 100 microm. H2S (100 microm) markedly increased open probability by more than 2-fold of single K(ATP) channels (inside-out recording) in native INS-1E cells (n = 4, P < 0.05). Single-channel conductance and ATP sensitivity of K(ATP) channels were not changed by H2S. In conclusion, endogenous H2S production from INS-1E cells varies with in vivo conditions, which significantly affects insulin secretion from INS-1E cells. H2S stimulates K(ATP) channels in INS-1E cells, independent of activation of cytosolic second messengers, which may underlie H2S-inhibited insulin secretion from these cells. Interaction among H2S, glucose and the K(ATP) channel may constitute an important and novel mechanism for the fine control of insulin secretion from pancreatic beta-cells.


Figures

Figure 1
Figure 1. H2S production and insulin secretion in INS-1E cells
A, glucose-mediated H2S production in INS-1E cells. Endogenous production of H2S was significantly decreased by high glucose concentration in the incubation medium. PPG (5 mm) treatment of INS-1E cells significantly reduced endogenous H2S production. *P < 0.05 versus other groups. n = 4 for each group. B, glucose-stimulated insulin secretion from INS-1E cells with Ad-CSE transfection to increase endogenous H2S level. *P < 0.05 versus native or Ad-LacZ-transfected INS-1E cells in the presence of 16 mm glucose. n = 6–8 for each group. C, production of H2S in Ad-CSE-transfected INS-1E cells. Cells were cultured with 16 mm glucose in the medium. *P < 0.05 versus other groups. n = 4–6 for each group.
Figure 2
Figure 2. Pharmacological sensitivities of whole-cell KATP channels in INS-1E cells
Holding potential, −20 mV. A, inhibition of the whole-cell KATP channels by gliclazide in INS-1E cells. Representative KATP channel currents (top panel) and the mean I–V relationship of whole-cell KATP channels (bottom panel, n = 5) before and after the application of gliclazide at 1 μm. B, stimulation of whole-cell KATP channels by diazoxide in INS-1E cells. Representative KATP channel currents (top panel) and the mean I–V relationships of KATP channels (bottom panel, n = 4) before and after application of diazoxide at 0.3 mm.
Figure 3
Figure 3. Single-channel characteristics of KATP channels recorded from inside-out membrane patches of INS-1E cells
A, representative single-channel KATP channel currents in one inside-out membrane patch (left panel) and the single-channel conductance of KATP channels (right panel, n = 5). B, open probabilities of single KATP channels in the absence (upper panel) and then presence (lower panel) of gliclazide (1 μm). Membrane potential, −60 mV.
Figure 4
Figure 4. Effects of glucose concentrations on basal KATP channel currents and interaction of H2S with KATP channels in INS-1E cells
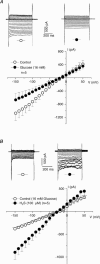
Holding potential, −20 mV. A, inhibitory effect of glucose on the whole-cell KATP channels in INS-1E cells. Representative KATP channel current traces (top panel) and the mean I–V relationships (bottom panel) of KATP channels with different glucose concentrations in the bath solutions. n = 5 for each group. *P < 0.05. B, interaction of H2S with whole-cell KATP channels in the presence of high glucose (16 mm) in the bath solution. Representative KATP channel current traces were shown in the top panel and the mean I–V relationships in the bottom panel of KATP channels in INS-1E cells before and after H2S application. n = 5 for each group.
Figure 5
Figure 5. Stimulatory effect of H2S on the whole-cell KATP channels of INS-1E cells in the presence of PPG in the pipette solution
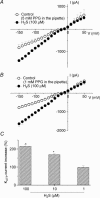
A, bath application of H2S at 100 μm increased inward KATP channel currents in INS-1E cells, which were dialysed with 5 mm PPG. n = 4. B, bath application of H2S at 100 μm increased inward KATP channel currents in INS-1E cells, which were dialysed with 1 mm PPG. n = 5. C, the concentration-dependent stimulatory effects of H2S on KATP channels with 1 mm PPG in the pipette solution. n = 5–6 for each group. *P < 0.05 versus the recordings in the absence of H2S.
Figure 6
Figure 6. Expression of CSE gene and production of H2S in cultured INS-1E cells
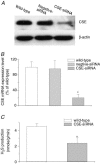
A, Western blot detection of CSE protein expression in INS-1E cells. B, real-time RT-PCR comparison of CSE expression levels in INS-1E cells with and without siRNA transfection. n = 4. *P < 0.01. C, endogenous production of H2S from INS-1E cells with or without transfection with CSE-siRNA. n = 3–5 for each group. *P < 0.05 versus native INS-1E cells.
Figure 7
Figure 7. Effects of H2S on the whole-cell KATP channels in CSE-siRNA-transfected INS-1E cells
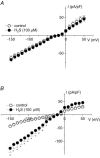
A, H2S (100 μm) had no effect on KATP channels in INS-1E cells transfected with negative siRNA. n = 4. B, H2S (100 μm) significantly increased KATP channel currents in INS-1E cells transfected with CSE-siRNA. n = 5. *P < 0.01.
Figure 8
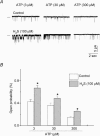
Figure 8. Activation of single KATP channels in INS-1E cell by H2S, recorded in inside-out configuration with symmetrical 140 mM KCl solutions
A, changes in open probability of single KATP channels induced by H2S. The close states of the channel are indicated by a bar beside each record. Membrane potential, +60 mV. Changes in opening probability (Po) are shown in the right panel. B, the effect of H2S on the single-channel conductance of KATP channels in INS-1E cells. Representative original records of KATP channels in the presence of H2S (100 μm) are shown in the left panel. The I–V relationship of KATP channels under these conditions is shown in the right panel. n = 6 for each data point.
Figure 9
Figure 9. The stimulatory effect of H2S on KATP channels in INS-1E cells was not related to ATP sensitivity of these channels
Single KATP channel currents in inside-out membrane patches (n = 4) were recorded with symmetrical 140 mm KCl solutions. A, representative single KATP channel currents in inside-out membrane patches before and after H2S (100 μm) of the bath solution at −60 mV membrane potential with different concentrations of ATP. Bar beside each trace indicates the closed state of the single channel. B, increasing concentrations of ATP in the cytosolic side of the membrane patches reduced open probability of single KATP channels, but did not alter the relative stimulatory effect of H2S. *P < 0.05 versus control.

References

    1. Abe K, Kimura H. The possible role of hydrogen sulfide as an endogenous neuromodulator. J Neurosci. 1996;16:1066–1071. - PMC - PubMed
    1. Ashcroft FM. Mechanism of the glycaemic effects of sulfonylureas. Horm Metab Res. 1996;28:456–463. - PubMed
    1. Ashcroft SJH. The β-cell KATP channel. J Membr Bio. 2000;176:187–206. - PubMed
    1. Ashcroft FM, Gribble FM. Correlating structure and function in ATP-sensitive K+ channels. Trends Neurosci. 1998;21:288–294. - PubMed
    1. Ashcroft FM, Rorsman P, Trube G. Single calcium channel activity in mouse pancreatic beta-cells. Ann N Y Acad Sci. 1989;560:410–412. - PubMed

Publication types

MeSH terms