. 2005 Nov 15;569(Pt 1):59-74.
doi: 10.1113/jphysiol.2005.094995. Epub 2005 Sep 22.

Protein kinase C shifts the voltage dependence of KCNQ/M channels expressed in Xenopus oocytes

Affiliations

Protein kinase C shifts the voltage dependence of KCNQ/M channels expressed in Xenopus oocytes

Koichi Nakajo et al. J Physiol. .

Abstract

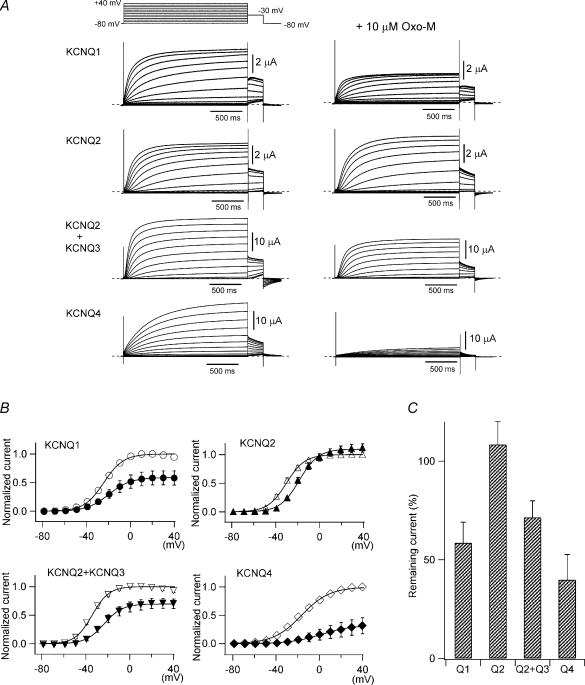
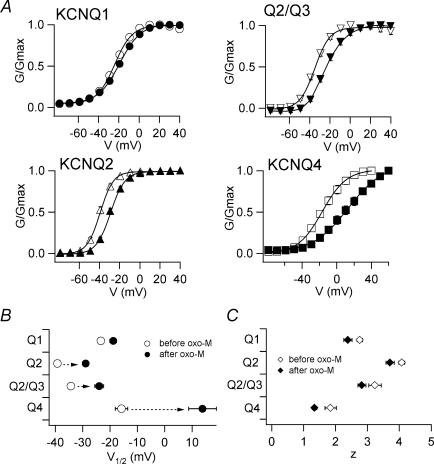
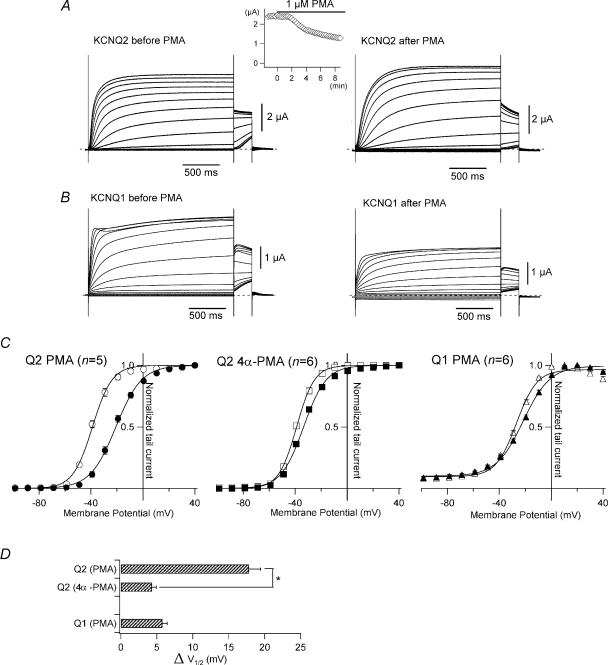
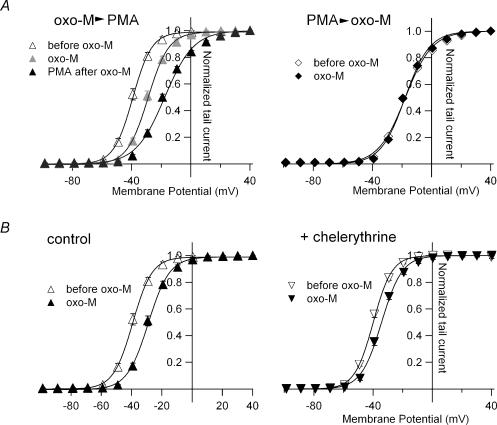
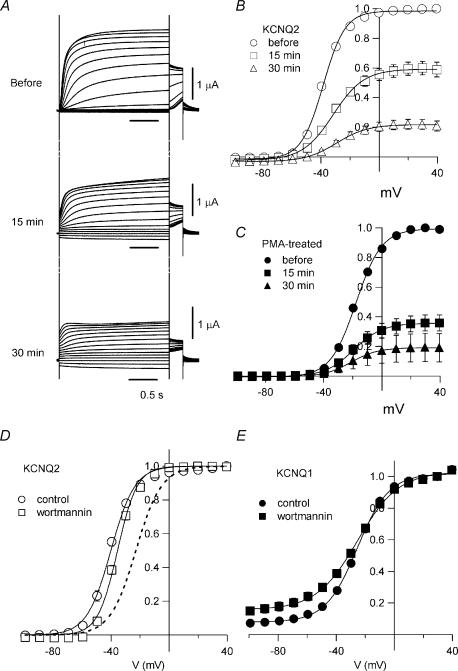
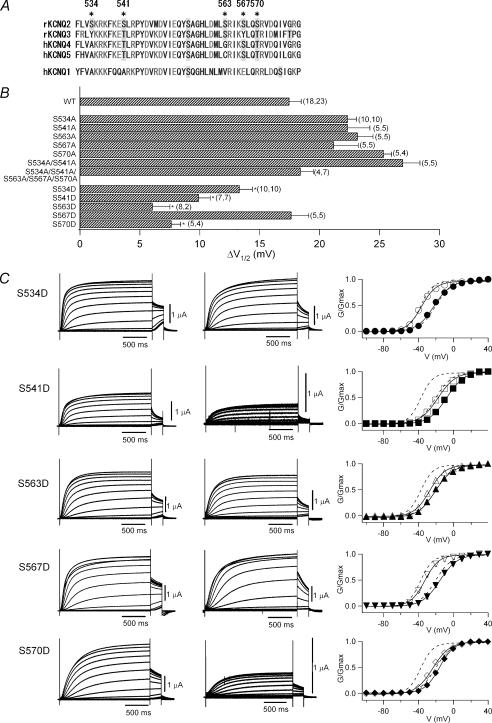
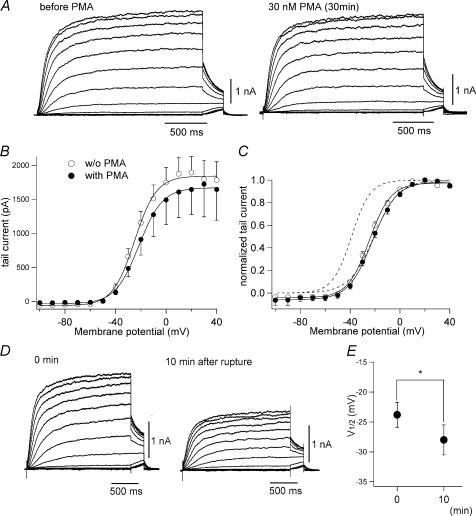
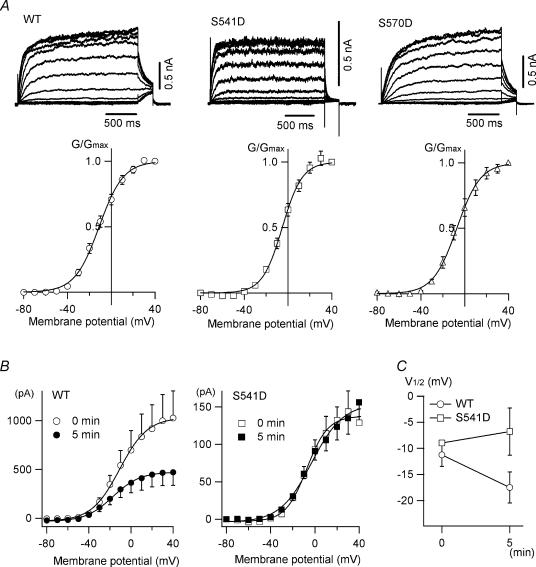
It is well established that stimulation of G(q)-coupled receptors such as the M1 muscarinic acetylcholine receptor inhibits KCNQ/M currents. While it is generally accepted that this muscarinic inhibition is mainly caused by the breakdown of PIP(2), the role of the subsequent activation of protein kinase C (PKC) is not well understood. By reconstituting M currents in Xenopus oocytes, we observed that stimulation of coexpressed M1 receptors with 10 microm oxotremorine M (oxo-M) induces a positive shift (4-30 mV, depending on which KCNQ channels are expressed) in the conductance-voltage relationship (G-V) of KCNQ channels. When we applied phorbol 12-myristate 13-acetate (PMA), a potent PKC activator, we observed a large positive shift (17.8 +/- 1.6 mV) in the G-V curve for KCNQ2, while chelerythrine, a PKC inhibitor, attenuated the shift caused by the stimulation of M1 receptors. By contrast, reducing PIP(2) had little effect on the G-V curve for KCNQ2 channels; although pretreating cells with 10 mum wortmannin for 30 min reduced KCNQ2 current amplitude by 80%, the G-V curve was shifted only slightly (5 mV). Apparently, the shift induced by muscarinic stimulation in Xenopus oocytes was mainly caused by PKC activation. When KCNQ2/3 channels were expressed in HEK 293T cells, the G-V curve seemed already to be shifted in a positive direction, even before activation of PKC, and PMA failed to shift the curve any further. That alkaline phosphatase in the patch pipette shifted the G-V curve in a negative direction suggests KCNQ2/3 channels are constitutively phosphorylated in HEK 293T cells.


Figures

Figure 1
Figure 1. KCNQ/M channels are inhibited by M1 receptor stimulation in Xenopus oocytes
KCNQ channels were coexpressed with M1 muscarinic acetylcholine receptors in Xenopus oocytes. A, representative recordings of currents through KCNQ1 (homotetramer), KCNQ2 (homo), KCNQ2 + KCNQ3 (hetero), and KCNQ4 (homo) channels before and 10 min after the application of 10 μm oxo-M. K+ currents were elicited by voltage steps between −80 and +40 mV followed by a step to −30 mV for tail current analysis. B, tail currents at −30 mV before and after muscarinic receptor stimulation are plotted against test potentials. Current amplitudes are normalized to the maximum tail current amplitude before receptor stimulation. Smooth curves were fitted using a two-state Boltzmann function (see Methods). C, remaining maximum current amplitudes after muscarinic stimulation are represented as percentages.
Figure 2
Figure 2. GV curves for KCNQ/M channels are shifted to more depolarized potentials by M1 receptor stimulation
A, GV curves for KCNQ channels before (open symbols) and after (filled symbols) muscarinic stimulation. Smooth curves were fitted using a two-state Boltzmann function. B and C, V½ (B) and z (C) obtained from the two-state Boltzmann function are plotted.
Figure 3
Figure 3. The GV curve for KCNQ2 is shifted by PMA
A, representative current recordings from KCNQ2 channels before and 20 min after application of 1 μm PMA. Currents were elicited by depolarization from −100 to +40 mV with a subsequent step to −30 mV for the tail current. The time course of PMA-induced inhibition is shown in the inset. Current amplitudes at −30 mV were plotted against time; 0 min indicates the time at which PMA was applied to the bath solution. B, representative current recordings from KCNQ1 channels before and 20 min after application of 1 μm PMA. C, GV curves for the KCNQ channels before (open symbols) and 20 min after (filled symbols) application of 1 μm PMA or 1 μm 4α-PMA (inactive isomer of PMA). Smooth curves were drawn by fitting the data with a two-state Boltzmann function. D, ΔV½ induced by 1 μm PMA or 1 μm 4α-PMA are plotted. The asterisk denotes statistical significance determined using an unpaired Student's t test.
Figure 4
Figure 4. PKC is a main pathway via which receptor stimulation induces GV shifts
A, left, GV curves for KCNQ2 channels obtained before and after sequential application of 10 μm oxo-M and 1 μm PMA. Right, GV curves for KCNQ2 channels before and after application of 10 μm oxo-M to PMA-pretreated cells. Oocytes expressing KCNQ2 channels were incubated with 30 nm PMA for 30 min before the recording. Smooth curves were drawn by fitting the data with a two-state Boltzmann function. B, left, GV curves for the KCNQ2 channel before and 10 min after application of 10 μm oxo-M (control). Right, GV curves for the chelerythrine-pretreated KCNQ2 channel before and 10 min after application of 10 μm oxo-M. Oocytes expressing KCNQ2 channels were incubated with 20 μm chelerythrine for 3 h before the recording. Smooth curves were drawn by fitting the data with a two-state Boltzmann function.
Figure 5
Figure 5. Reduction of PIP2 reduces KCNQ current amplitude and slightly affects GV curves
A, representative current recordings before and 15 min and 30 min after application of wortmannin. B, GV curves for KCNQ2 channels before and 15 min and 30 min after application of wortmannin. Forty per cent of the KCNQ2 current was inhibited after 15 min and 80% after 30 min. C, GV curves for PMA-treated KCNQ2 channels before and 15 min and 30 min after application of wortmannin. Sixty per cent of the KCNQ2 current was inhibited after 15 min and 80% after 30 min. D, GV curves for KCNQ2 channels with (○) or without (□) 30 min pretreatment with 10 μm wortmannin. The dashed curve represents the GV curve for PMA-treated KCNQ2 channels (from Fig. 3C). V½ values were −41.0 ± 1.0 mV (control; n = 6), −36.0 ± 0.9 mV (wortmannin; n = 6; P < 0.005) and −23.1 ± 0.5 mV (PMA; n = 6; P < 0.001). E, GV curve for KCNQ1 channels, which were not affected by PMA (see Fig. 2), were not shifted by wortmannin; V½ was −25.8 ± 0.7 mV (control; n = 5) or −25.3 ± 1.9 mV (wortmannin; n = 5; P > 0.05), though the KCNQ1 current was inhibited by 78% after incubation for 30 min with 10 μm wortmannin (data not shown).
Figure 6
Figure 6. Single S→D mutations within the A-domain of KCNQ2 affects the voltage dependence
A, amino acid sequences of A-domain of rat KCNQ2, rat KCNQ3, human KCNQ4, human KCNQ5 and human KCNQ1. Serine and threonine residues are shaded in grey. Asterisks indicate mutated serine residues in this study. B, changes in V½V½) after 30-min incubation with 30 nm PMA. Mutants that caused a significant decrease of ΔV½ relative to wild-type (WT, top) are indicated with asterisks. The number of measurements (n) for each data point is indicated in parentheses; the left number indicating n for recordings without PMA incubation and the right number indicating n for recordings after 30-min PMA incubation. C, representative current traces for S→D KCNQ2 mutants with or without 30-min incubation with 30 nm PMA. Currents were elicited by depolarization from −100 to +40 mV. The GV curve for each mutant with (filled symbols) or without (open symbols) PMA incubation is also shown in the right column. Smooth curves correspond to a two-state Boltzmann function. Dotted curves correspond to fittings obtained with the two-state Boltzmann function for wild-type KCNQ2 channels before and after application of PMA (from Fig. 3C).
Figure 7
Figure 7. Voltage dependence of KCNQ2/3 channels in HEK 293T cells is insensitive to PMA but sensitive to alkaline phosphatase
A, representative KCNQ2/3 current traces recorded from HEK 293T cells before (left) and after 30-min incubation with 30 nm PMA (right). B, mean tail current amplitudes at −30 mV plotted against prepulse voltages. C, GV curve for KCNQ2/3 channels with or without PMA treatment. PMA did not shift GV curves in HEK 293T cells. For comparison, dotted curves represent the GV curves for KCNQ2 channels in Xenopus oocytes with and without PMA treatment (from Fig. 3C). D, representative KCNQ2/3 current traces recorded from HEK 293T cells 0 min (left) and 10 min (right) after membrane rupture. The patch pipette contained 50 U ml−1 alkaline phosphatase. E, change in V½ induced by alkaline phosphatase is plotted (n = 9; P = 0.01).
Figure 8
Figure 8. Voltage dependence of wild-type KCNQ2 channels and S→D mutants in HEK 293T cells
A, homomeric wild-type KCNQ2 channels and S541D and S570D mutants were expressed in HEK 293T cells. Shown are representative traces and GV curves acquired from tail currents at −30 mV; V½ is −10.7 ± 1.9, −4.0 ± 1.7 and −5.7 ± 2.7 mV for wild-type, S541D and S570D, respectively. B, tail current amplitudes at −30 mV from KCNQ2 current traces recorded at 0 min (open symbols) and 5 min (filled symbols) after membrane rupture. The patch pipette contained 50 U ml−1 alkaline phosphatase. C, changes in V½ induced by alkaline phosphatase are plotted (n = 4 for wild-type and n = 3 for S541D).

Similar articles

Cited by

References

    1. Andersen OS. The 58th annual meeting and symposium of the Society of General Physiologists: lipid signaling in physiology. J General Physiol. 2005;125:103–110. - PMC - PubMed
    1. Bosma MM, Hille B. Protein kinase C is not necessary for peptide-induced suppression of M current or for desensitization of the peptide receptors. Proc Natl Acad Sci U S A. 1989;86:2943–2947. - PMC - PubMed
    1. Brown DA, Adams PR. Muscarinic suppression of a novel voltage-sensitive K+ current in a vertebrate neurone. Nature. 1980;283:673–676. - PubMed
    1. Brown DA, Higashida H. Inositol 1,4,5-trisphosphate and diacylglycerol mimic bradykinin effects on mouse neuroblastoma x rat glioma hybrid cells. J Physiol. 1988;397:185–207. - PMC - PubMed
    1. Caulfield MP, Jones S, Vallis Y, Buckley NJ, Kim GD, Milligan G, Brown DA. Muscarinic M-current inhibition via Gαq/11 and α-adrenoceptor inhibition of Ca2+ current via Gαo in rat sympathetic neurones. J Physiol. 1994;477:415–422. - PMC - PubMed

Publication types

LinkOut - more resources