. 2005 Sep 23;309(5743):2033-7.
doi: 10.1126/science.1114535.

An aneuploid mouse strain carrying human chromosome 21 with Down syndrome phenotypes

Affiliations

An aneuploid mouse strain carrying human chromosome 21 with Down syndrome phenotypes

Aideen O'Doherty et al. Science. .

Abstract

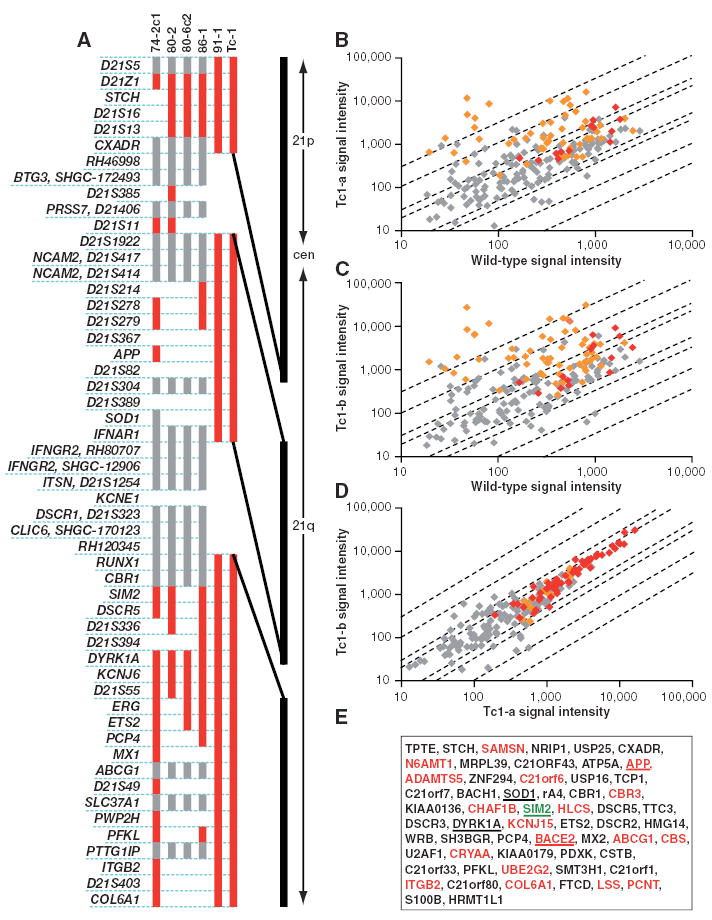
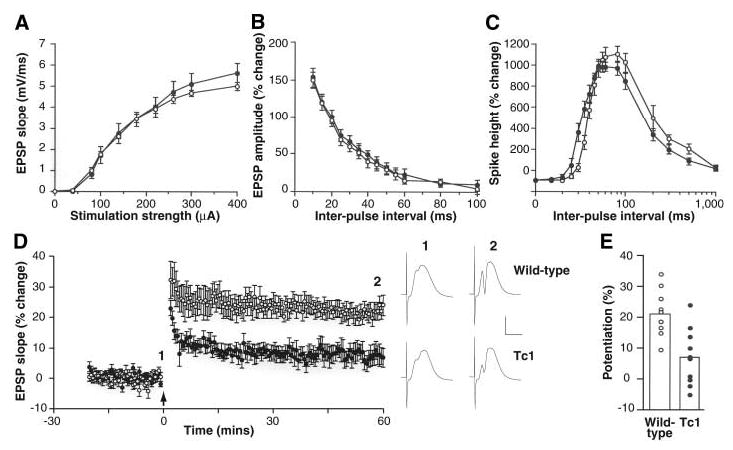
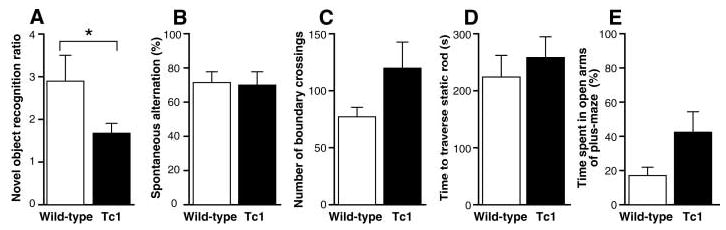
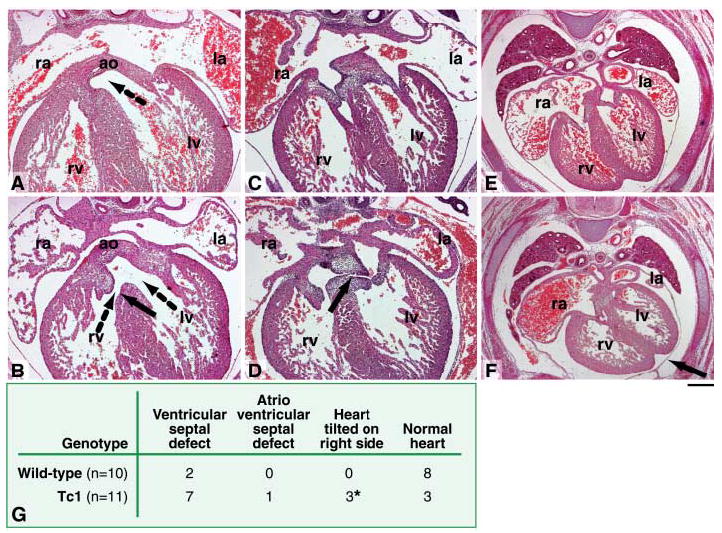
Aneuploidies are common chromosomal defects that result in growth and developmental deficits and high levels of lethality in humans. To gain insight into the biology of aneuploidies, we manipulated mouse embryonic stem cells and generated a trans-species aneuploid mouse line that stably transmits a freely segregating, almost complete human chromosome 21 (Hsa21). This "transchromosomic" mouse line, Tc1, is a model of trisomy 21, which manifests as Down syndrome (DS) in humans, and has phenotypic alterations in behavior, synaptic plasticity, cerebellar neuronal number, heart development, and mandible size that relate to human DS. Transchromosomic mouse lines such as Tc1 may represent useful genetic tools for dissecting other human aneuploidies.


Figures

Fig. 1
Fig. 1
DNA and expression analysis of transchromosomic cell lines and mice carrying Hsa21. (A) Hsa21 content in five transchromosomic ES cell lines (74-2c1, 80-2, 80-6c2, 86-1, and 91-1) and Tc1 mouse DNAs. Cell line and mouse names are shown above the vertical bars that indicate the presence of the Hsa21 markers listed on the left. Markers are shown in order but are not spaced relative to their distance apart on Hsa21 (positions are given in table S1). Red denotes the presence of the marker, gray denotes not scored, and a blank space denotes a negative score, i.e., the marker was not present. CXADR was shown to be present by microarray results from Tc1 embryos. The vertical black line on the right is a scaled representation of the physical map of Hsa21, showing the relative spacing and maximum sizes of the two gaps. cen, centromere. (B to E) RNA samples from two Tc1 whole embryos and one wild-type littermate (E14.5) were hybridized to Affymetrix HG-U133A GeneChips. Array data were scaled to a target intensity of 500 before analysis. (B and C) Scatter plots showing Hsa21 gene signal intensities of embryos (B) Tc1-a and (C) Tc1-b against the wild-type littermate. (D) Scatter plot showing Hsa21 gene signal intensities of embryo Tc1-a against Tc1-b as a hybridization control. In each scatter plot, red points represent genes called present in both embryos, orange points represent genes called present in one of the two embryos, and gray points represent genes below the threshold for detection in both embryos. Diagonal lines indicate the thresholds for twofold, threefold, tenfold, and thirtyfold differences between the two embryos. (E) Genes with increased expression in Tc1 embryos compared to wild-type embryos. Red lettering indicates those found with the reduced stringency search method. Underlined genes were also found by RT-PCR or immunoblot. Expression of one gene, SIM2 (green), was detected by RT-PCR but not by microarray analysis.
Fig. 2
Fig. 2
Short-term plasticity is normal but LTP is impaired in the dentate gyrus of Tc1 mice. (A) Input-output curves, (B) paired-pulse facilitation of the field excitatory postsynaptic potential (EPSP), and (C) paired-pulse modulation of the population spike are similar in wild-type (open circles) and Tc1 (solid circles) littermates. (D) LTP averaged for a group of 9 wild-type mice (open circles) and 10 Tc1 littermates (solid circles). The arrow marks the tetanus (six series of six trains of six stimuli at 400 Hz, with 200 ms between trains and 20 s between series). One hour after the tetanus, the magnitude of LTP was 21.9 ± 2.6% in wild-type mice, compared with 7.4 ± 2.9% in Tc1 mutants (P < 0.001, 2-tailed t test). Sample potentials from a single wild-type and a single Tc1 mouse, recorded just before () and 60 min after () the tetanus, are displayed on the right. Calibration, 5 mV, 5 ms. (E) The magnitude of LTP, measured 55 to 60 min after induction, is displayed for each wild-type mouse (open circles) and each Tc1 mutant (solid circles). The open histobars indicate the means for each group. All error bars represent SEM.
Fig. 3
Fig. 3
Tc1 mice have a hippocampus-dependent learning and memory deficit. (A) An index of novel-object exploration (the ratio of time spent exploring a novel object to mean time spent exploring a familiar object) in 12 wild-type (open) and 10 Tc1 (solid) littermates reveals a deficit in novel-object recognition in Tc1 mice (*, P < 0.05). Wild-type mice took significantly more time exploring a novel object than objects A and B, which had been presented in a training session 10 min previously (object A, 27.7 ± 16.9 s; object B, 31.8 ± 25.0 s; novel object, 69.0 ± 35.2 s; P < 0.05 for the novel object compared to either object A or B but not significant for object A compared to object B). (B) Five Tc1 mice and seven wild-type littermates performed above chance in the spontaneous alternation T-maze, but levels of alternation are not significantly different across genotypes. (C) Ten Tc1 mice displayed a nonsignificant trend toward hyperactivity in an open field compared with 12 wild-type littermates. (D) Testing on a static rod task revealed no significant motor deficit in five Tc1 mice as compared with seven wild-type littermates. (E) Five Tc1 mice did not spend significantly more time in the open arms of an elevated plus maze than seven wild-type littermates, although a nonsignificant trend may reflect overall increased levels of activity. All error bars represent SEM.
Fig. 4
Fig. 4
Cardiac defects in Tc1 fetuses. Transverse sections of E14.5 Tc1 and wild-type littermates, stained with hematoxylin and eosin. (A) Normal ventricular septation in a wild-type fetus, showing fusion of the interventricular septum with the proximal regions of the outflow tract cushions. The dotted arrow shows communication between the aorta and the left ventricle. (B) A perimembranous ventricular septal defect (solid arrow) in a Tc1 fetus, allowing the flow of blood between the right and left ventricles. In this case, the aorta is overriding the ventricular septum, allowing blood to enter the aorta from both the right and left ventricles (dotted arrows). (C) Normal atrioventricular septation in a wild-type fetus, showing fusion of the inferior and superior atrioventricular cushions and the primary atrial septum with the superior cushion. (D) Atrioventricular septal defect in a Tc1 fetus, showing that the inferior and superior atrioventricular cushions remain unfused (black arrow). (E) Normal positioning of the heart in a wild-type fetus. (F) In a Tc1 fetus the heart is tilted on to its right side, causing the interventricular sulcus to point to the left (black arrow). Scale bar, (A to D) 100 μm; (E and F) 200 μm. ao, aorta; la, left atrium; lv, left ventricle; ra, right atrium; rv, right ventricle. (G) Incidence of cardiac defects in Tc1 fetuses and their wild-type littermates. The asterisk indicates mice that also had ventricular septal defects.

Comment in

References

    1. Chrast R, et al. Hum Mol Genet. 2000;9:1853. - PubMed
    1. Smith DJ, et al. Nat Genet. 1997;16:28. - PubMed
    1. Antonarakis SE, Lyle R, Dermitzakis ET, Reymond A, Deutsch S. Nat Rev Genet. 2004;5:725. - PubMed
    1. Nelson DL, Gibbs RA. Science. 2004;306:619. - PubMed
    1. Gardiner K, Fortna A, Bechtel L, Davisson MT. Gene. 2003;318:137. - PubMed

Publication types

MeSH terms

Substances