. 2005;107(5):335-44.
doi: 10.1016/j.acthis.2005.06.013. Epub 2005 Sep 21.

Direct targeting of cancer cells: a multiparameter approach

Affiliations

Direct targeting of cancer cells: a multiparameter approach

Eileen L Heinrich et al. Acta Histochem. 2005.

Abstract

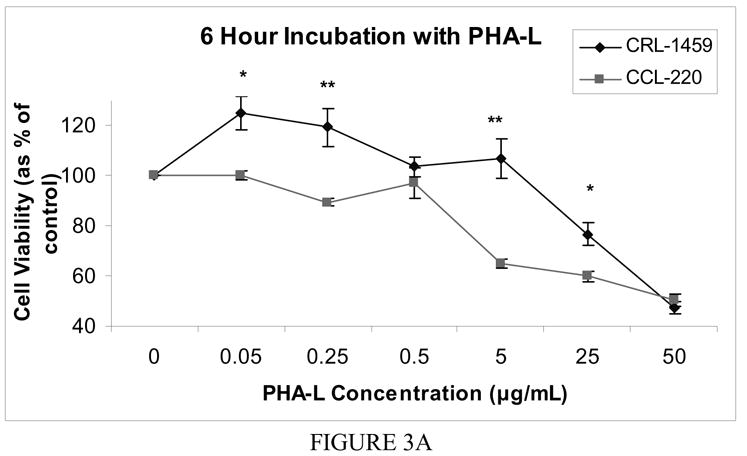
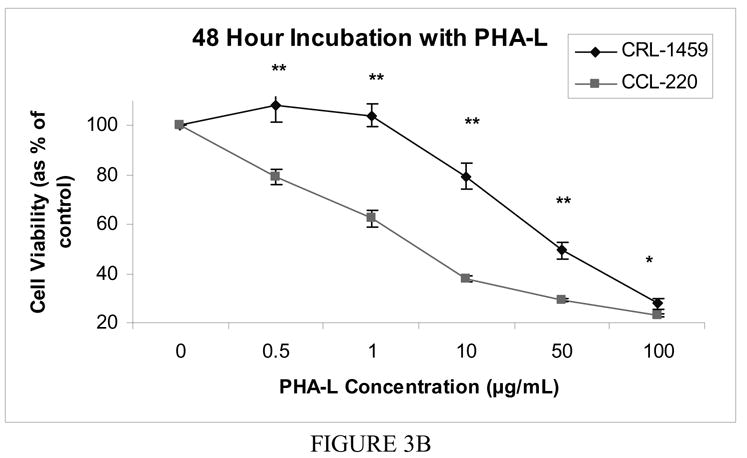
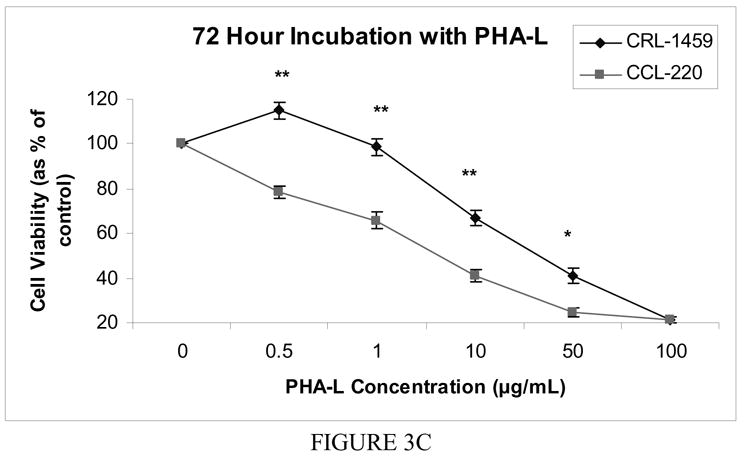
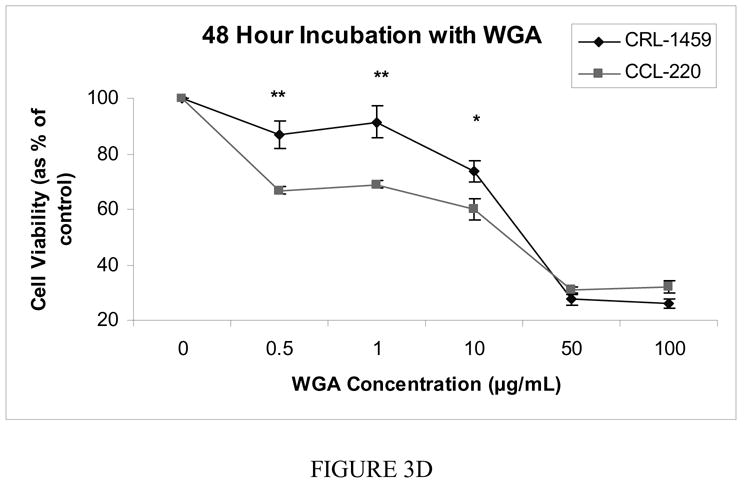
Lectins have been widely used in cell surface studies and in the development of potential anticancer drugs. Many past studies that have examined lectin toxicity have only evaluated the effects on cancer cells, not their non-cancer counterparts. In addition, few past studies have evaluated the relationship between lectin-cell binding and lectin toxicity on both cell types. Here we examine these parameters in one study: lectin-cell binding and lectin toxicity with both cancer cells and their normal counterparts. We found that the human colon cancer cell line CCL-220/Colo320DM bound to agarose beads derivatized with Phaseolus vulgaris agglutinin (PHA-L) and wheat germ agglutinin (WGA), while the non-cancer human colon cell line CRL-1459/CCD-18Co did not. When these lectins were tested for their effects on cell viability in culture, both cell lines were affected by the lectins but at 6, 48 and 72 h incubation times, PHA-L was most toxic to the cancer cell line in a concentration dependent manner. At 48 h incubation, WGA was more toxic to the cancer cell line. The results suggest that it may be possible to develop lectin protocols that selectively target cancer cells for death. In any case, examination of both malignant cells and their non-malignant counterparts, analysis of their binding characteristics to immobilized lectins, and examination of the toxicity of free lectins in culture, provides a multiparameter model for obtaining more comprehensive information than from more limited approaches.


Figures

Figure 1
Figure 1
Figure 1a Binding of PHA-L derivatized agarose beads and CCL-220 cells in distilled water Positive binding result shown. Fixed CCL-220 cells are small spheres, PHA-L derivatized beads are large spheres. Tapping the slide did not separate bound cells and beads. Magnification 200x. Figure 1b Binding of PHA-L derivatized agarose beads and CCL-220 in 0.2M D (+)-glucosamine Negative binding result shown. Fixed CCL-220 cells are small spheres, PHA-L derivatized beads are large spheres. Tapping the slide did not separate bound cells and beads. Magnification 200x. Figure 1c Binding result of PHA-L derivatized agarose beads and CCL-220 in 0.2M L (−)-fucose, a non-inhibiting sugar Positive binding result shown. Fixed CCL-220 cells are small spheres, PHA-L derivatized beads are large spheres. Magnification 200x. Figure 1d Binding result of PHA-L derivatized agarose beads and CRL-1459 in distilled water Negative binding result shown. Fixed CRL-1459 cells are small spheres, PHA-L derivatized beads are large spheres. Magnification 200x.
Figure 1
Figure 1
Figure 1a Binding of PHA-L derivatized agarose beads and CCL-220 cells in distilled water Positive binding result shown. Fixed CCL-220 cells are small spheres, PHA-L derivatized beads are large spheres. Tapping the slide did not separate bound cells and beads. Magnification 200x. Figure 1b Binding of PHA-L derivatized agarose beads and CCL-220 in 0.2M D (+)-glucosamine Negative binding result shown. Fixed CCL-220 cells are small spheres, PHA-L derivatized beads are large spheres. Tapping the slide did not separate bound cells and beads. Magnification 200x. Figure 1c Binding result of PHA-L derivatized agarose beads and CCL-220 in 0.2M L (−)-fucose, a non-inhibiting sugar Positive binding result shown. Fixed CCL-220 cells are small spheres, PHA-L derivatized beads are large spheres. Magnification 200x. Figure 1d Binding result of PHA-L derivatized agarose beads and CRL-1459 in distilled water Negative binding result shown. Fixed CRL-1459 cells are small spheres, PHA-L derivatized beads are large spheres. Magnification 200x.
Figure 2
Figure 2. Standard curve for absorbance and cell concentration
Shows the absorbance plotted against CCL-220 cell concentrations after MTT assay.
Figure 3
Figure 3
Figure 3a Cell viability after 6 hour incubation with free PHA-L Cell viability was determined by MTT colorimetric assay. The mean value of the optical density measured in the control condition (no lectin added) was defined as 100% survival with other conditions reported as a percent of the control value. Error bars show standard error of the mean. * indicates p < 0.05, ** indicates p<0.0001. Figure 3b Cell viability after 48 hour incubation with free PHA-L Cell viability was determined by MTT colorimetric assay. The mean value of the optical density measured in the control condition (no lectin added) was defined as 100% survival with other conditions reported as a percent of the control value. Error bars show standard error of the mean. * indicates p < 0.05, ** indicates p<0.0001. Figure 3c Cell viability after 72 hour incubation with free PHA-L Cell viability was determined by MTT colorimetric assay. The mean value of the optical density measured in the control condition (no lectin added) was defined as 100% survival with other conditions reported as a percent of the control value. Error bars show standard error of the mean. * indicates p < 0.05, ** indicates p<0.0001. Figure 3d Cell viability after 48 hour incubation with free WGA Cell viability was determined by MTT colorimetric assay. The mean value of the optical density measured in the control condition (no lectin added) was defined as 100% survival with other conditions reported as a percent of the control value. Error bars show standard error of the mean. * indicates p < 0.05, ** indicates p<0.0001.
Figure 3
Figure 3
Figure 3a Cell viability after 6 hour incubation with free PHA-L Cell viability was determined by MTT colorimetric assay. The mean value of the optical density measured in the control condition (no lectin added) was defined as 100% survival with other conditions reported as a percent of the control value. Error bars show standard error of the mean. * indicates p < 0.05, ** indicates p<0.0001. Figure 3b Cell viability after 48 hour incubation with free PHA-L Cell viability was determined by MTT colorimetric assay. The mean value of the optical density measured in the control condition (no lectin added) was defined as 100% survival with other conditions reported as a percent of the control value. Error bars show standard error of the mean. * indicates p < 0.05, ** indicates p<0.0001. Figure 3c Cell viability after 72 hour incubation with free PHA-L Cell viability was determined by MTT colorimetric assay. The mean value of the optical density measured in the control condition (no lectin added) was defined as 100% survival with other conditions reported as a percent of the control value. Error bars show standard error of the mean. * indicates p < 0.05, ** indicates p<0.0001. Figure 3d Cell viability after 48 hour incubation with free WGA Cell viability was determined by MTT colorimetric assay. The mean value of the optical density measured in the control condition (no lectin added) was defined as 100% survival with other conditions reported as a percent of the control value. Error bars show standard error of the mean. * indicates p < 0.05, ** indicates p<0.0001.

Similar articles

Cited by

References

    1. Bakalova R, Ohba H. Interaction of soybean agglutinin with leukemic T-cells and its use for their in vitro separation from normal lymphocytes by lectin-affinity chromatography. Biomedical Chromatography. 2003;17:239–49. - PubMed
    1. Banchonglikitkul C, Smart JD, Gibbs RV, Donovan SJ, Cook DJ. An in vitro evaluation of lectin cytotoxicity using cell lines derived from the ocular surface. Journal of Drug Targeting. 2002;10:601–6. - PubMed
    1. Camby I, Salmon I, De Decker R, Pasteels J-L, Brotchi J, Danguy A, Kiss R. Lectin histochemistry of astrocytic tumors and in vivo characterization of lectin-induced modifications on the proliferations of the SW1088, U373 and U87 human astrocytic cell lines. Journal of Neuro-Oncology. 1997;34:111–22. - PubMed
    1. Clark MA, Jepson MA, Simmons NL, Hirst BH. Selective binding and transcytosis of Ulex europaeus 1 lectin by mouse Peyer’s patch M-cells in vivo. Cell & Tissue Research. 1995;282:455–61. - PubMed
    1. Fritz P, Dippon J, Kierschke T, Siegle I, Mohring A, Moisa A, Murdter TE. Impact of mistletoe lectin binding in breast cancer. Anticancer Research. 2004;24:1187–92. - PubMed

Publication types

MeSH terms