Comparative Study
. 2005 Oct 4;102(40):14404-9.
doi: 10.1073/pnas.0503920102. Epub 2005 Sep 23.

Use of gene expression profiling to direct in vivo molecular imaging of lung cancer

Affiliations
Comparative Study

Use of gene expression profiling to direct in vivo molecular imaging of lung cancer

Jan Grimm et al. Proc Natl Acad Sci U S A. .

Abstract

Using gene expression profiling, we identified cathepsin cysteine proteases as highly up-regulated genes in a mouse model of human lung adenocarcinoma. Overexpression of cathepsin proteases in these lung tumors was confirmed by immunohistochemistry and Western blotting. Therefore, an optical probe activated by cathepsin proteases was selected to detect murine lung tumors in vivo as small as 1 mm in diameter and spatially separated. We generated 3D maps of the fluorescence signal and fused them with anatomical computed tomography images to show a close correlation between fluorescence signal and tumor burden. By serially imaging the same mouse, optical imaging was used to follow tumor progression. This study demonstrates the capability for molecular imaging of a primary lung tumor by using endogenous proteases expressed by a tumor. It also highlights the feasibility of using gene expression profiling to identify molecular targets for imaging lung cancer.


Figures

Fig. 1.
Fig. 1.
IHC of lungs from tumor-bearing and control mice show overexpression of cathepsins H, B, and L in tumors. Insets in the ×10 IHCs show adjacent slices processed without primary antibody. Insets in the ×40 IHCs show ×100 magnification.
Fig. 2.
Fig. 2.
Immunoblots of lysates of normal lung and from isolated tumors show overexpression of cathepsin H, B, and L protein in tumors. Vinculin immunoblotting was performed as a loading control. Lane 1, lysate from normal lung; lanes 2-5, lysates from different individual tumors. The double signal for cathepsins H and B is due to different glycosylation states of the cathepsin protein.
Fig. 3.
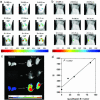
Fig. 3.
In vivo and ex vivo fluorescence imaging of lung tumors. (a) FMT identifies lung tumors in mice. The 3D FMT image is displayed at different depths of the coronal plane (z axis). The fluorescence signals that are superimposed over the white light image reveal tumors. (b) FMT of control mouse shows little fluorescence signal. (c) Lung from a mouse with tumor or without tumor (control) was removed 24 h after i.v. injection of probe and imaged with fluorescence reflectance imaging. The fluorescence signal from the control lung is close to the background. In contrast, a clear signal is detectable in tumor-bearing lungs, with the highest signals coming from the areas of macroscopically identifiable tumors indicated (arrows). FRI, fluorescence reflectance image; SI, signal intensity. (d) Correlation between the amount of cathepsin B in individually isolated tumors and the corresponding signal intensity by fluorescence reflectance imaging.
Fig. 4.
Fig. 4.
Comparison of FMT and CT images of lung tumors. (a) FMT-white light fusion, CT, and FMT-CT fusion images of a tumor-bearing mouse (two slices at different depths) and of a control mouse (one position). (b) 3D reconstructions of the bulk tumor mass in CT (Left) and of the FMT signal (Right) show a good correlation.
Fig. 5.
Fig. 5.
FMT of mice demonstrating the limits of tumor detection and serial imaging of tumor progression. (a) Limits of tumor detection: FMT-white light (WL) fusion, CT, and FMT-CT fusion images 11 weeks after infection with Adeno-Cre show that some tumors (white arrows) can be detected by FMT but that a smaller individual tumor (red arrow) cannot be detected. (b) Tumor progression: Coronal CT, FMT-WL fusion, CT-FMT fusion, and axial CT images through the tumor (arrow) of the same LSL-KrasG12D mouse 8 and 11 weeks after Adeno-Cre infection. Serial imaging of the same mouse with FMT over time detects tumor progression. The structure outlined in blue in the coronal CT image at 8 weeks is a pleural effusion that has resolved by 11 weeks; the tumor is outlined in red.

References

    1. Branda, C. S. & Dymecki, S. M. (2004) Dev. Cell 6, 7-28. - PubMed
    1. Jackson, E. L., Willis, N., Mercer, K., Bronson, R. T., Crowley, D., Montoya, R., Jacks, T. & Tuveson, D. A. (2001) Genes Dev. 15, 3243-3248. - PMC - PubMed
    1. Pelosi, G., Scarpa, A., Manzotti, M., Veronesi, G., Spaggiari, L., Fraggetta, F., Nappi, O., Benini, E., Pasini, F., Antonello, D., et al. (2004) Mod. Pathol. 17, 538-546. - PubMed
    1. Okudela, K., Hayashi, H., Ito, T., Yazawa, T., Suzuki, T., Nakane, Y., Sato, H., Ishi, H., KeQin, X., Masuda, A., et al. (2004) Am. J. Pathol. 164, 91-100. - PMC - PubMed
    1. Kim, D. H., Kim, J. S., Park, J. H., Lee, S. K., Ji, Y. I., Kwon, Y. M., Shim, Y. M., Han, J. & Park, J. (2003) Cancer Res. 63, 6206-6211. - PubMed

Publication types