Diversification of stem cell molecular repertoire by alternative splicing
- PMID: 16183747
- PMCID: PMC1242282
- DOI: 10.1073/pnas.0502132102
Diversification of stem cell molecular repertoire by alternative splicing
Abstract
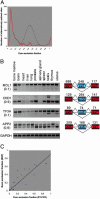
Complete information regarding transcriptional and posttranscriptional gene regulation in stem cells is necessary to understand the regulation of self-renewal and differentiation. Alternative splicing is a prevalent mode of posttranscriptional regulation, and occurs in approximately one half of all mammalian genes. The frequency and functional impact of alternative splicing in stem cells are yet to be determined. In this study we combine computational and experimental methods to identify splice variants in embryonic and hematopoietic stem cells on a genome-wide scale. Using EST collections derived from stem cells, we detect alternative splicing in >1,000 genes. Systematic RT-PCR and sequencing studies show confirmation of computational predictions at a level of 80%. We find that alternative splicing can modify multiple components of signaling pathways important for stem cell function. We also analyze the distribution of splice variants across different classes of genes. We find that tissue-specific genes have a higher tendency to undergo alternative splicing than ubiquitously expressed genes. Furthermore, the patterns of alternative splicing are only weakly conserved between orthologous genes in human and mouse. Our studies reveal extensive modification of the stem cell molecular repertoire by alternative splicing and provide insights into its overall role as a mechanism of generating genomic diversity.
Figures


Similar articles
-
Alternative splicing events identified in human embryonic stem cells and neural progenitors.PLoS Comput Biol. 2007 Oct;3(10):1951-67. doi: 10.1371/journal.pcbi.0030196. Epub 2007 Aug 24. PLoS Comput Biol. 2007. PMID: 17967047 Free PMC article.
-
Gene structure prediction and alternative splicing analysis using genomically aligned ESTs.Genome Res. 2001 May;11(5):889-900. doi: 10.1101/gr.155001. Genome Res. 2001. PMID: 11337482 Free PMC article.
-
Bioinformatics detection of alternative splicing.Methods Mol Biol. 2008;452:179-97. doi: 10.1007/978-1-60327-159-2_9. Methods Mol Biol. 2008. PMID: 18566765 Review.
-
Alternative splicing increases complexity of stem cell transcriptome.Cell Cycle. 2006 Feb;5(4):347-51. doi: 10.4161/cc.5.4.2424. Epub 2006 Feb 15. Cell Cycle. 2006. PMID: 16479168
-
Functional consequences of developmentally regulated alternative splicing.Nat Rev Genet. 2011 Sep 16;12(10):715-29. doi: 10.1038/nrg3052. Nat Rev Genet. 2011. PMID: 21921927 Free PMC article. Review.
Cited by
-
Alternative RNA splicing in stem cells and cancer stem cells: Importance of transcript-based expression analysis.World J Stem Cells. 2021 Oct 26;13(10):1394-1416. doi: 10.4252/wjsc.v13.i10.1394. World J Stem Cells. 2021. PMID: 34786151 Free PMC article. Review.
-
Inactivation of a single copy of Crebbp selectively alters pre-mRNA processing in mouse hematopoietic stem cells.PLoS One. 2011;6(8):e24153. doi: 10.1371/journal.pone.0024153. Epub 2011 Aug 25. PLoS One. 2011. PMID: 21901164 Free PMC article.
-
Functional importance of different patterns of correlation between adjacent cassette exons in human and mouse.BMC Genomics. 2008 Apr 26;9:191. doi: 10.1186/1471-2164-9-191. BMC Genomics. 2008. PMID: 18439302 Free PMC article.
-
RNA binding proteins in the regulation of heart development.Int J Biochem Cell Biol. 2013 Nov;45(11):2467-78. doi: 10.1016/j.biocel.2013.08.008. Epub 2013 Aug 20. Int J Biochem Cell Biol. 2013. PMID: 23973289 Free PMC article. Review.
-
Low conservation and species-specific evolution of alternative splicing in humans and mice: comparative genomics analysis using well-annotated full-length cDNAs.Nucleic Acids Res. 2008 Nov;36(20):6386-95. doi: 10.1093/nar/gkn677. Epub 2008 Oct 5. Nucleic Acids Res. 2008. PMID: 18838389 Free PMC article.
References
-
- Sharp, P. A. (1994) Cell 77, 805-815. - PubMed
-
- Lopez, A. J. (1998) Annu. Rev. Genet. 32, 279-305. - PubMed
-
- Smith, C. W. & Valcarcel, J. (2000) Trends Biochem. Sci. 25, 381-388. - PubMed
-
- Black, D. L. (2003) Annu. Rev. Biochem. 72, 291-336. - PubMed
-
- Lander, E. S., Linton, L. M., Birren, B., Nusbaum, C., Zody, M. C., Baldwin, J., Devon, K., Dewar, K., Doyle, M., FitzHugh, et al. (2001) Nature 409, 860-921. - PubMed
Publication types
MeSH terms
LinkOut - more resources
Full Text Sources
Other Literature Sources
Medical
Molecular Biology Databases
Research Materials

