

The regulation of Rubisco activity in response to variation in temperature and atmospheric CO2 partial pressure in sweet potato
- PMID: 16183840
- PMCID: PMC1256011
- DOI: 10.1104/pp.105.066233
The regulation of Rubisco activity in response to variation in temperature and atmospheric CO2 partial pressure in sweet potato
Abstract
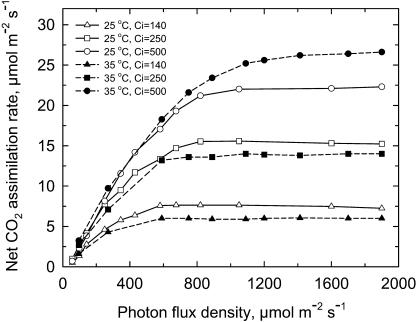
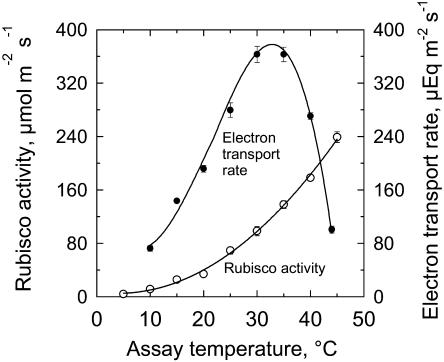
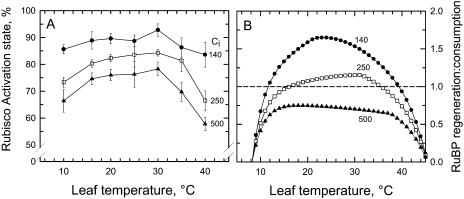
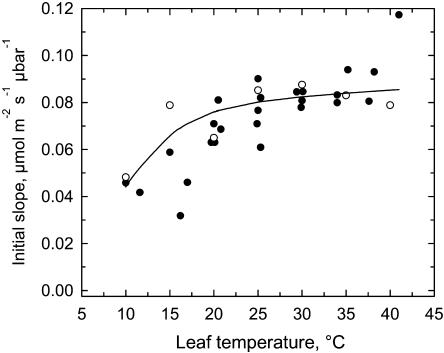
The temperature response of net CO(2) assimilation rate (A), the rate of whole-chain electron transport, the activity and activation state of Rubisco, and the pool sizes of ribulose-1,5-bisphosphate (RuBP) and 3-phosphoglyceric acid (PGA) were assessed in sweet potato (Ipomoea batatas) grown under greenhouse conditions. Above the thermal optimum of photosynthesis, the activation state of Rubisco declined with increasing temperature. Doubling CO(2) above 370 mubar further reduced the activation state, while reducing CO(2) by one-half increased it. At cool temperature (<16 degrees C), the activation state of Rubisco declined at CO(2) levels where photosynthesis was unaffected by a 90% reduction in O(2) content. Reduction of the partial pressure of CO(2) at cool temperature also enhanced the activation state of Rubisco. The rate of electron transport showed a pronounced temperature response with the same temperature optimum as A at elevated CO(2). RuBP pool size and the RuBP-to-PGA ratio declined with increasing temperature. Increasing CO(2) also reduced the RuBP pool size. These results are consistent with the hypothesis that the reduction in the activation state of Rubisco at high and low temperature is a regulated response to a limitation in one of the processes contributing to the rate of RuBP regeneration. To further evaluate this possibility, we used measured estimates of Rubisco capacity, electron transport capacity, and the inorganic phosphate regeneration capacity to model the response of A to temperature. At elevated CO(2), the activation state of Rubisco declined at high temperatures where electron transport capacity was predicted to be limiting, and at cooler temperatures where the inorganic phosphate regeneration capacity was limiting. At low CO(2), where Rubisco capacity was predicted to limit photosynthesis, full activation of Rubisco was observed at all measurement temperatures.
Figures


Similar articles
-
The single-process biochemical reaction of Rubisco: a unified theory and model with the effects of irradiance, CO₂ and rate-limiting step on the kinetics of C₃ and C₄ photosynthesis from gas exchange.Biosystems. 2011 Feb;103(2):265-84. doi: 10.1016/j.biosystems.2010.11.004. Epub 2010 Nov 18. Biosystems. 2011. PMID: 21093535
-
The temperature response of photosynthesis in tobacco with reduced amounts of Rubisco.Plant Cell Environ. 2008 Apr;31(4):407-18. doi: 10.1111/j.1365-3040.2008.01778.x. Epub 2008 Jan 24. Plant Cell Environ. 2008. PMID: 18182015
-
Effects of Rubisco kinetics and Rubisco activation state on the temperature dependence of the photosynthetic rate in spinach leaves from contrasting growth temperatures.Plant Cell Environ. 2006 Aug;29(8):1659-70. doi: 10.1111/j.1365-3040.2006.01550.x. Plant Cell Environ. 2006. PMID: 16898026
-
The temperature response of C(3) and C(4) photosynthesis.Plant Cell Environ. 2007 Sep;30(9):1086-106. doi: 10.1111/j.1365-3040.2007.01682.x. Plant Cell Environ. 2007. PMID: 17661749 Review.
-
Rubisco, Rubisco activase, and global climate change.J Exp Bot. 2008;59(7):1581-95. doi: 10.1093/jxb/ern053. Epub 2008 Apr 23. J Exp Bot. 2008. PMID: 18436544 Review.
Cited by
-
Heat stress and bleaching in corals: a bioenergetic model.Coral Reefs. 2024;43(6):1627-1645. doi: 10.1007/s00338-024-02561-1. Epub 2024 Oct 30. Coral Reefs. 2024. PMID: 39553893 Free PMC article.
-
Metabolic modeling identifies determinants of thermal growth responses in Arabidopsis thaliana.New Phytol. 2025 Jul;247(1):178-190. doi: 10.1111/nph.20420. Epub 2025 Jan 24. New Phytol. 2025. PMID: 39856022 Free PMC article.
-
Photosynthetic electron transport and proton flux under moderate heat stress.Photosynth Res. 2009 Apr;100(1):29-43. doi: 10.1007/s11120-009-9420-8. Epub 2009 Apr 3. Photosynth Res. 2009. PMID: 19343531
-
The temperature response of CO2 assimilation, photochemical activities and Rubisco activation in Camelina sativa, a potential bioenergy crop with limited capacity for acclimation to heat stress.Planta. 2012 Nov;236(5):1433-45. doi: 10.1007/s00425-012-1691-1. Epub 2012 Jun 26. Planta. 2012. PMID: 22733425
-
Rubisco in planta kcat is regulated in balance with photosynthetic electron transport.J Exp Bot. 2009;60(14):4077-88. doi: 10.1093/jxb/erp242. Epub 2009 Aug 6. J Exp Bot. 2009. PMID: 19661266 Free PMC article.
References
-
- Berry JA, Raison JK (1981) Responses of macrophytes to temperature. In OL Lange, PS Nobel, CB Osmond, H Ziegler, eds, Physiological Plant Ecology I: Responses to the Physical Environment, Vol 12A. Springer-Verlag, Berlin, pp 277–338
-
- Brooks A, Farquhar GD (1985) Effect of temperature on the CO2/O2 specificity of ribulose-1,5-bisphosphate carboxylase oxygenase and the rate of respiration in the light—estimates from gas-exchange measurements on spinach. Planta 165: 397–406 - PubMed
-
- Bukhov NG, Wiese C, Neimanis S, Heber U (1999) Heat sensitivity of chloroplasts and leaves: leakage of protons from thylakoids and reversible activation of cyclic electron transport. Photosynth Res 59: 81–93
-
- Crafts-Brandner SJ, Law RD (2000) Effect of heat stress on the inhibition and recovery of the ribulose-1,5-bisphosphate carboxylase/oxygenase activation state. Planta 212: 67–74 - PubMed
Publication types
MeSH terms
Substances
LinkOut - more resources
Full Text Sources
Other Literature Sources
