Comparative Study
. 2005 Oct;139(2):822-35.
doi: 10.1104/pp.105.065961. Epub 2005 Sep 23.

Comparative transcriptional profiling of two contrasting rice genotypes under salinity stress during the vegetative growth stage

Affiliations
Comparative Study

Comparative transcriptional profiling of two contrasting rice genotypes under salinity stress during the vegetative growth stage

Harkamal Walia et al. Plant Physiol. 2005 Oct.

Abstract

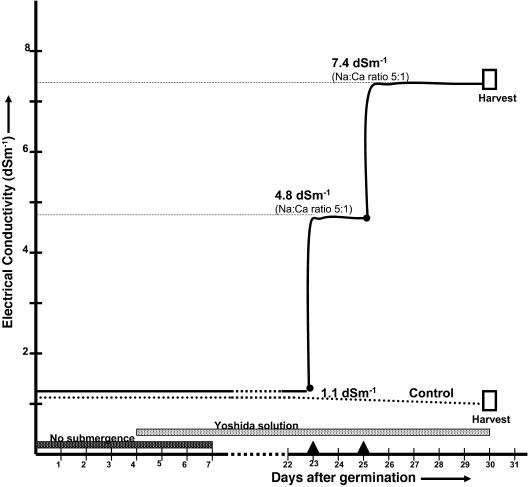
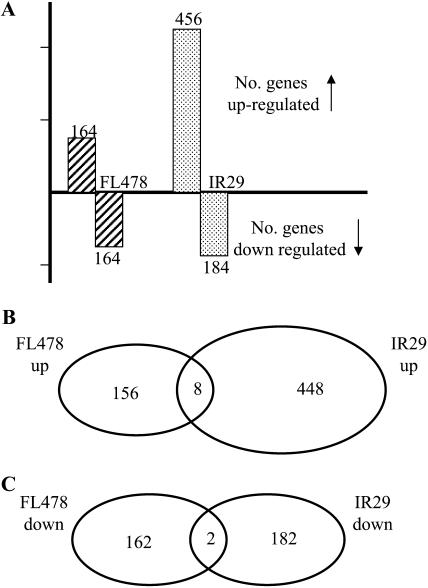
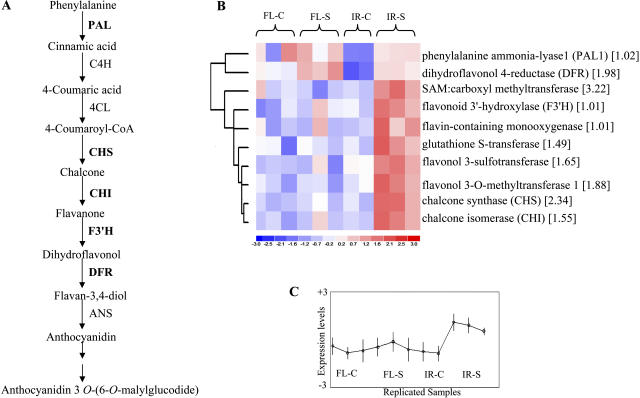
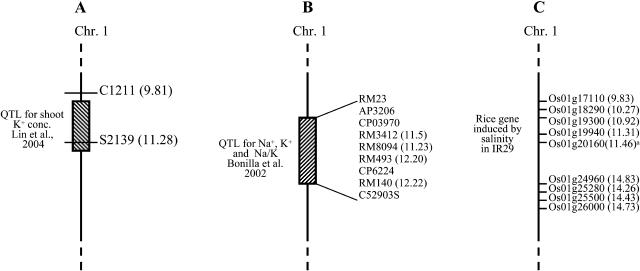
Rice (Oryza sativa), a salt-sensitive species, has considerable genetic variation for salt tolerance within the cultivated gene pool. Two indica rice genotypes, FL478, a recombinant inbred line derived from a population developed for salinity tolerance studies, and IR29, the sensitive parent of the population, were selected for this study. We used the Affymetrix rice genome array containing 55,515 probe sets to explore the transcriptome of the salt-tolerant and salt-sensitive genotypes under control and salinity-stressed conditions during vegetative growth. Response of the sensitive genotype IR29 is characterized by induction of a relatively large number of probe sets compared to tolerant FL478. Salinity stress induced a number of genes involved in the flavonoid biosynthesis pathway in IR29 but not in FL478. Cell wall-related genes were responsive in both genotypes, suggesting cell wall restructuring is a general adaptive mechanism during salinity stress, although the two genotypes also had some differences. Additionally, the expression of genes mapping to the Saltol region of chromosome 1 were examined in both genotypes. Single-feature polymorphism analysis of expression data revealed that IR29 was the source of the Saltol region in FL478, contrary to expectation. This study provides a genome-wide transcriptional analysis of two well-characterized, genetically related rice genotypes differing in salinity tolerance during a gradually imposed salinity stress under greenhouse conditions.


Figures

Figure 1.
Figure 1.
Experimental design of salinity stress treatment. The seedlings were submerged 7 d after germination. Yoshida solution was applied from day 4. A final salinity level of 7.4 dS m−1 was reached by a two-step addition of NaCl and CaCl2 on days 23 and 25 after germination. A Na:Ca molar ratio of 5:1 was maintained during the addition of salts. Conductivity in the control tank is represented by a dotted line and in the treated tank by a solid line. Black circles represent addition of salt, and rectangles represent the harvest time points. The crown and growing point of the main shoot were harvested for expression analysis 30 d after germination.
Figure 2.
Figure 2.
Number of differentially expressed probe sets. A, The histogram shows the total number of probe sets up- or down-regulated in FL478 and IR29 in response to salinity stress at a level of 2-fold or more and a P value < 0.05. B, Venn diagram illustrates the probe sets induced in either or both genotypes. C, Venn diagram illustrates the number of probe sets down-regulated under salinity stress. It is important to point out that a single gene described on the basis of best BLAST hits against the TIGR rice database is in many cases represented by multiple probe sets. Therefore, the probe set overlap between FL478 and IR29 is an underestimation of the number of shared differentially expressed rice gene models.
Figure 3.
Figure 3.
Flavonoid biosynthesis pathway induced in IR29 under salt stress. A, A simplified scheme for anthocyanin and flavonoid biosynthesis. Enzymes encoded by genes that are induced during salinity stress in sensitive genotype IR29 are in boldface. C4H, Cinnamate-4-hydroxylase; 4CL, 4-coumarate:CoA ligase; F3H, flavanone 3-hydroxylase; ANS, anthocyanidin synthase. B, The heat map display of genes related to the flavonoid pathway using hierarchical clustering. FL-C, FL478 control; FL-S, FL478 salinity stress; IR-C, IR29 control; IR-S, IR29 salinity stress. The difference in mean expression between control and stress conditions for IR29 (log2) is listed in square brackets. The expression values of the probe sets are scaled within a range from +3 (red) to −3 (blue). Red represents up-regulation, and blue represents down-regulation. The averaged expression value for each replicate from each genotype and treatment is shown in C. The vertical line through each of the plotted points represents error for the expression value. Expression values on the y axis are scaled from +3 to −3, corresponding to the heat map in B. The probe sets corresponding to the genes on the heat map are as follows: PAL1 (Os.27728.1.S1_at), DFR (Os.23101.1.A1_at), SAM:carboxyl methyltransferase (Os.11812.1.S1_at), flavonoid 3-hydroxylase (Os.10510.1.S1_at), flavin-containing monooxygenase (Os.5265.1.S1_x_at), GST (Os.13014.1.S1_a_at), flavonol 3-sulfotransferase (OsAffx.29191.1.S1_at), flavonol 3-O-methyltransferase (OsAffx.13783.1.S1_at), CHS (Os.12416.1.S1_at), and CHI (Os.9929.1.S1_at).
Figure 4.
Figure 4.
Chromosome 1 segment associated with a major QTL for salinity tolerance. A, Lin et al. (2004) described a QTL, qSKC-1, denoting shoot potassium concentration under salt stress. This QTL localizes between 9.81 and 11.28 Mb based on approximation of associated marker locations. B, An overlapping region flanked by markers RM23 and C52903S was identified by Bonilla et al. (2002) contributing to three quantitative traits (low Na+ absorption, high K+, and a low Na+-to-K+ ratio) in a mapping population derived from a cross between Pokkali and IR29. Additional markers were generated by E.B. Tumimgang, D.L. Adorada, J. Niones, F. Elahi, Z. Seraj, J. Dvorjak, and G.B. Gregorio. C, Rice genes induced in IR29 that colocalize to the same region under salt stress in our stress treatment. Rice gene Os1g20160 (11.46 Mb) is a cation transporter that is induced in both FL478 and IR29 under salinity stress.

Similar articles

Cited by

References

    1. Albinsky D, Masson JE, Bogucki A, Afsar K, Vass I, Nagy F, Paszkowski J (1999) Plant responses to genotoxic stress are linked to an ABA/salinity signaling pathway. Plant J 17: 73–82
    1. Baluska F, Samaj J, Menzel D (2003) Polar transport of auxin: carrier-mediated flux across the plasma membrane or neurotransmitter-like secretion? Trends Cell Biol 13: 282–285 - PubMed
    1. Bonilla P, Dvorak J, Mackill D, Deal K, Gregorio G (2002) RFLP and SSLP mapping of salinity tolerance genes in chromosome 1 of rice (Oryza sativa L.) using recombinant inbred lines. Philippine J Agric Sci 85: 68–76
    1. Cao Y, Ward JM, Kelly WB, Ichida AM, Gaber RF, Anderson JA, Uozumi N, Schroeder JI, Crawford NM (1995) Multiple genes, tissue specificity and expression-dependent modulation contribute to the functional diversity of potassium channels in Arabidopsis thaliana. Plant Physiol 109: 1093–1106 - PMC - PubMed
    1. Carpita NC (1996) Structure and biogenesis of the cell walls in grasses. Annu Rev Plant Physiol Plant Mol Biol 47: 445–476 - PubMed

Publication types

MeSH terms