

Genome-wide analysis of hydrogen peroxide-regulated gene expression in Arabidopsis reveals a high light-induced transcriptional cluster involved in anthocyanin biosynthesis
- PMID: 16183842
- PMCID: PMC1255997
- DOI: 10.1104/pp.105.065896
Genome-wide analysis of hydrogen peroxide-regulated gene expression in Arabidopsis reveals a high light-induced transcriptional cluster involved in anthocyanin biosynthesis
Abstract
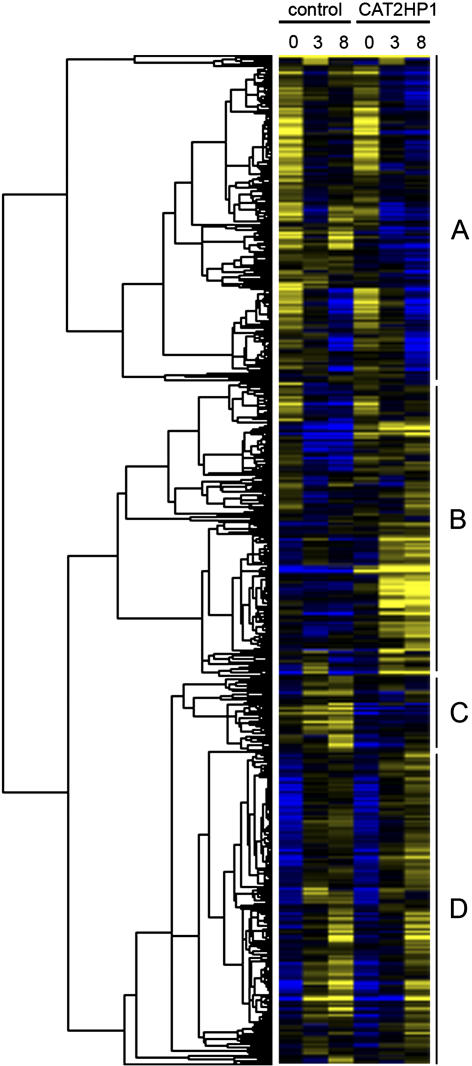
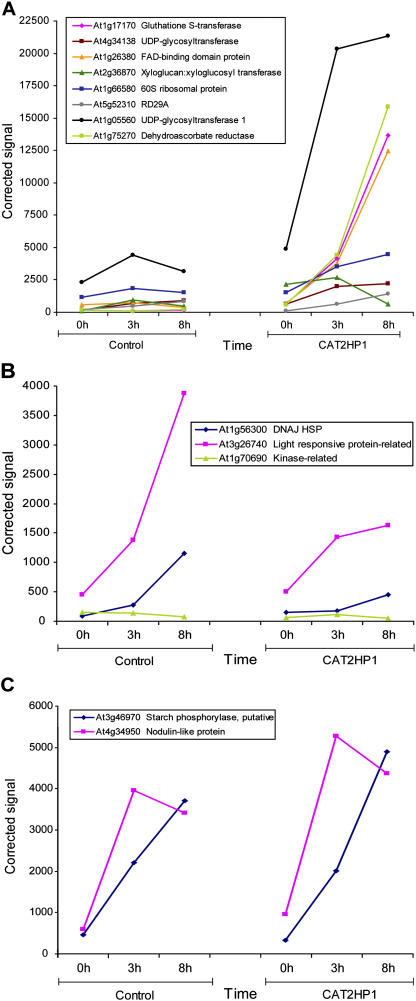
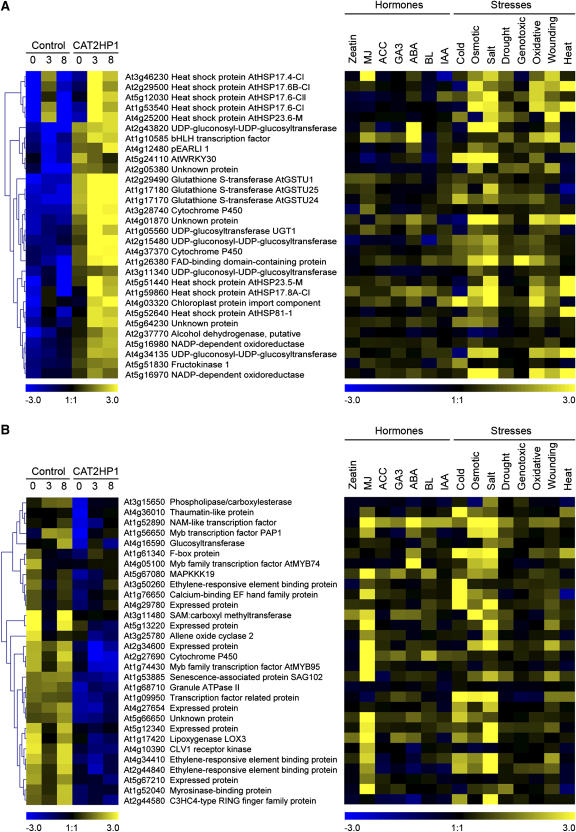
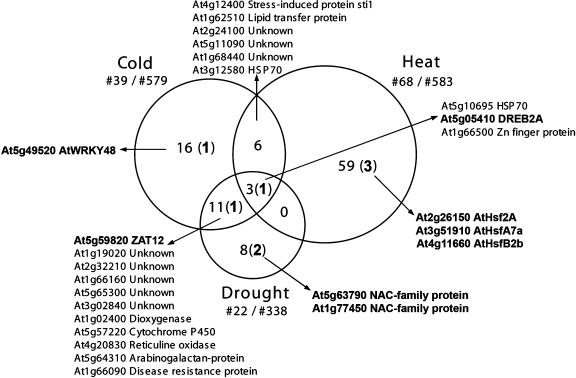
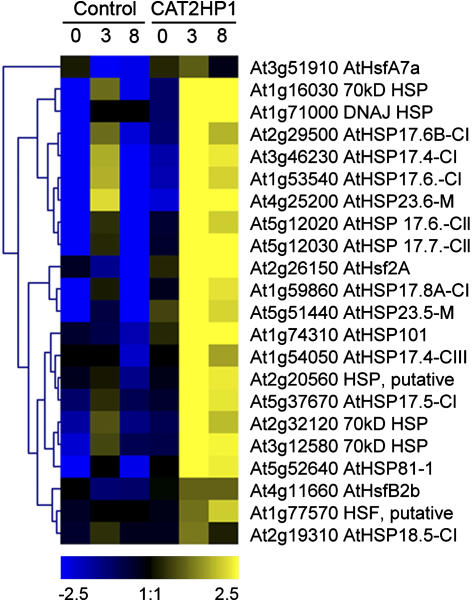
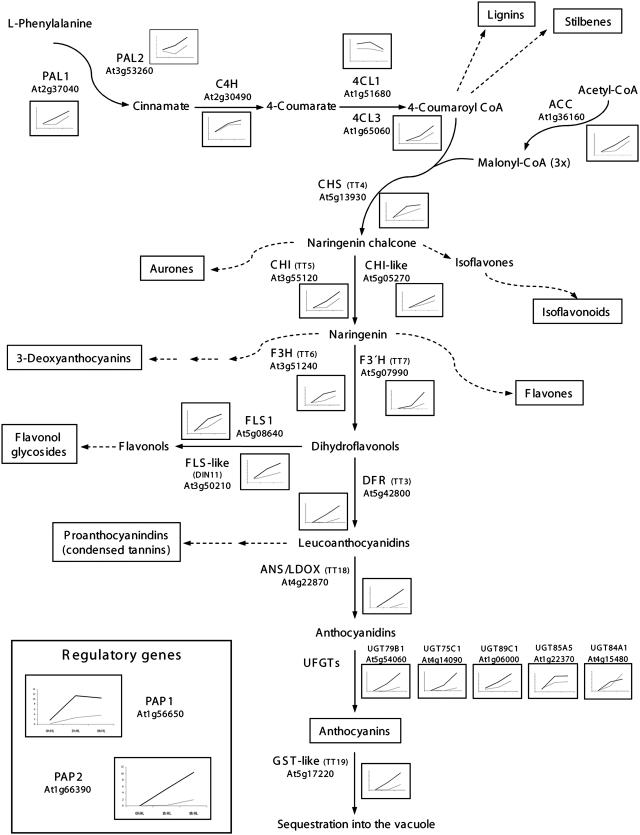
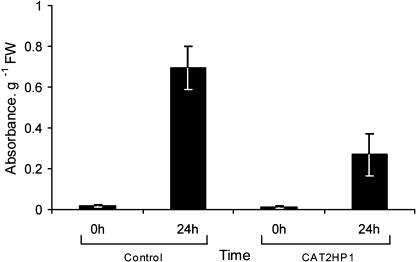
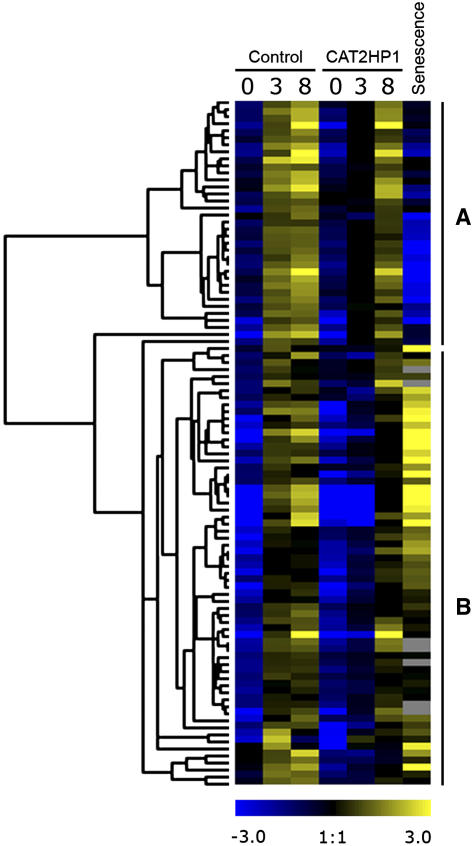
In plants, reactive oxygen species and, more particularly, hydrogen peroxide (H(2)O(2)) play a dual role as toxic by-products of normal cell metabolism and as regulatory molecules in stress perception and signal transduction. Peroxisomal catalases are an important sink for photorespiratory H(2)O(2). Using ATH1 Affymetrix microarrays, expression profiles were compared between control and catalase-deficient Arabidopsis (Arabidopsis thaliana) plants. Reduced catalase levels already provoked differences in nuclear gene expression under ambient growth conditions, and these effects were amplified by high light exposure in a sun simulator for 3 and 8 h. This genome-wide expression analysis allowed us to reveal the expression characteristics of complete pathways and functional categories during H(2)O(2) stress. In total, 349 transcripts were significantly up-regulated by high light in catalase-deficient plants and 88 were down-regulated. From this data set, H(2)O(2) was inferred to play a key role in the transcriptional up-regulation of small heat shock proteins during high light stress. In addition, several transcription factors and candidate regulatory genes involved in H(2)O(2) transcriptional gene networks were identified. Comparisons with other publicly available transcriptome data sets of abiotically stressed Arabidopsis revealed an important intersection with H(2)O(2)-deregulated genes, positioning elevated H(2)O(2) levels as an important signal within abiotic stress-induced gene expression. Finally, analysis of transcriptional changes in a combination of a genetic (catalase deficiency) and an environmental (high light) perturbation identified a transcriptional cluster that was strongly and rapidly induced by high light in control plants, but impaired in catalase-deficient plants. This cluster comprises the complete known anthocyanin regulatory and biosynthetic pathway, together with genes encoding unknown proteins.
Figures
Similar articles
-
Catalase deficiency drastically affects gene expression induced by high light in Arabidopsis thaliana.Plant J. 2004 Jul;39(1):45-58. doi: 10.1111/j.1365-313X.2004.02105.x. Plant J. 2004. PMID: 15200641
-
Growth suppression, altered stomatal responses, and augmented induction of heat shock proteins in cytosolic ascorbate peroxidase (Apx1)-deficient Arabidopsis plants.Plant J. 2003 Apr;34(2):187-203. doi: 10.1046/j.1365-313x.2003.01715.x. Plant J. 2003. PMID: 12694594
-
Day length is a key regulator of transcriptomic responses to both CO(2) and H(2)O(2) in Arabidopsis.Plant Cell Environ. 2012 Feb;35(2):374-87. doi: 10.1111/j.1365-3040.2011.02368.x. Epub 2011 Jul 6. Plant Cell Environ. 2012. PMID: 21631535
-
Evolutionary analysis of anthocyanin biosynthetic genes: insights into abiotic stress adaptation.Plant Mol Biol. 2024 Dec 16;115(1):6. doi: 10.1007/s11103-024-01540-y. Plant Mol Biol. 2024. PMID: 39680184 Review.
-
Could heat shock transcription factors function as hydrogen peroxide sensors in plants?Ann Bot. 2006 Aug;98(2):279-88. doi: 10.1093/aob/mcl107. Epub 2006 Jun 1. Ann Bot. 2006. PMID: 16740587 Free PMC article. Review.
Cited by
-
2-cysteine peroxiredoxins and thylakoid ascorbate peroxidase create a water-water cycle that is essential to protect the photosynthetic apparatus under high light stress conditions.Plant Physiol. 2015 Apr;167(4):1592-603. doi: 10.1104/pp.114.255356. Epub 2015 Feb 9. Plant Physiol. 2015. PMID: 25667319 Free PMC article.
-
Chemical PARP inhibition enhances growth of Arabidopsis and reduces anthocyanin accumulation and the activation of stress protective mechanisms.PLoS One. 2012;7(5):e37287. doi: 10.1371/journal.pone.0037287. Epub 2012 May 25. PLoS One. 2012. PMID: 22662141 Free PMC article.
-
Expression of catalase and retinoblastoma-related protein genes associates with cell death processes in Scots pine zygotic embryogenesis.BMC Plant Biol. 2015 Mar 15;15:88. doi: 10.1186/s12870-015-0462-0. BMC Plant Biol. 2015. PMID: 25887788 Free PMC article.
-
Gene network downstream plant stress response modulated by peroxisomal H2O2.Front Plant Sci. 2022 Aug 23;13:930721. doi: 10.3389/fpls.2022.930721. eCollection 2022. Front Plant Sci. 2022. PMID: 36082297 Free PMC article.
-
Redox Balance-DDR-miRNA Triangle: Relevance in Genome Stability and Stress Responses in Plants.Front Plant Sci. 2019 Aug 2;10:989. doi: 10.3389/fpls.2019.00989. eCollection 2019. Front Plant Sci. 2019. PMID: 31428113 Free PMC article. Review.
References
-
- Aharoni A, De Vos CHR, Wein M, Sun Z, Greco R, Kroon A, Mol JNM, O'Connell AP (2001) The strawberry FaMYB1 transcription factor suppresses anthocyanin and flavonol accumulation in transgenic tobacco. Plant J 28: 319–332 - PubMed
-
- Apel K, Hirt H (2004) Reactive oxygen species: metabolism, oxidative stress, and signal transduction. Annu Rev Plant Biol 55: 373–399 - PubMed
-
- Banzet N, Richaud C, Deveaux Y, Kazmaizer M, Gagnon J, Triantaphylidès C (1998) Accumulation of small heat shock proteins, including mitochondrial HSP22, induced by oxidative stress and adaptive response in tomato cells. Plant J 13: 519–527 - PubMed
-
- Baudry A, Heim MA, Dubreucq B, Caboche M, Weisshaar B, Lepiniec L (2004) TT2, TT8, and TTG1 synergistically specify the expression of BANYULS and proanthocyanidin biosynthesis in Arabidopsis thaliana. Plant J 39: 366–380 - PubMed
Publication types
MeSH terms
Substances
LinkOut - more resources
Full Text Sources
Other Literature Sources
Molecular Biology Databases
