. 2005 Oct;139(2):999-1014.
doi: 10.1104/pp.105.065037. Epub 2005 Sep 23.

Mating-induced shedding of cell walls, removal of walls from vegetative cells, and osmotic stress induce presumed cell wall genes in Chlamydomonas

Affiliations

Mating-induced shedding of cell walls, removal of walls from vegetative cells, and osmotic stress induce presumed cell wall genes in Chlamydomonas

Xenia-Katharina Hoffmann et al. Plant Physiol. 2005 Oct.

Abstract

The first step in sexual differentiation of the unicellular green alga Chlamydomonas reinhardtii is the formation of gametes. Three genes, GAS28, GAS30, and GAS31, encoding Hyp-rich glycoproteins that presumably are cell wall constituents, are expressed in the late phase of gametogenesis. These genes, in addition, are activated by zygote formation and cell wall removal and by the application of osmotic stress. The induction by zygote formation could be traced to cell wall shedding prior to gamete fusion since it was seen in mutants defective in cell fusion. However, it was absent in mutants defective in the initial steps of mating, i.e. in flagellar agglutination and in accumulation of adenosine 3',5'-cyclic monophosphate in response to this agglutination. Induction of the three GAS genes was also observed when cultures were exposed to hypoosmotic or hyperosmotic stress. To address the question whether the induction seen upon cell wall removal from both gametes and vegetative cells was elicited by osmotic stress, cell wall removal was performed under isosmotic conditions. Also under such conditions an activation of the genes was observed, suggesting that the signaling pathway(s) is (are) activated by wall removal itself.


Figures
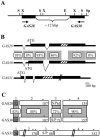
Figure 1.
Figure 1.
GAS28, GAS30, and GAS31 gene structures and homology between predicted gene products. A, Arrangement of GAS28 and GAS30 within the C. reinhardtii genome. B, Structures of the GAS28, GAS30, and GAS31 genes. Solid lines indicate 5′ and 3′ UTRs. Black boxes indicate deduced protein coding exons; hatched boxes indicate sequences encoding ser(pro)x-rich domains; dotted lines indicate introns. Homology between segments of GAS28 and GAS30 sequences is given in percentage of identity. C, The deduced amino acid sequences of GAS28, GAS30, and GAS31 are grouped in four domains. The boxes indicate the different predicted protein domains (numbered one to four): the secretion signals (dark gray boxes), the N-terminal globular domain, the ser(pro)x-rich domain (S/P), and the C-terminal globular domain. The numbers of amino acids in each domain are given within the boxes. Asterisks indicate potential sites for N-linked glycosylation. Homology between GAS28 and GAS30 domains is given in percentage of amino acid identity.
Figure 2.
Figure 2.
Predicted gene models within the C. reinhardtii genome that may encode proteins with homology to GAS28 and GAS30. N-terminal and C-terminal domains from GAS28 and GAS30 were BLAST searched against sequences of the current draft release, version 2.0, of the C. reinhardtii genome (http://genome.jgi-psf.org/chlre2/chlre2.home.html) using the program tBLASTn. Gene models listed in Table I were used for the alignment. A, Alignment of domain 2 (Fig. 1B) of GAS28 and GAS30 against products of predicted genes of the C. reinhardtii genome. B, Alignment of domain 4 (Fig. 1B) of GAS28 and GAS30 against products of predicted genes of the C. reinhardtii genome. Sequences of gene models obtained from the BLAST search were translated with BCM six frame translation utilities, aligned using ClustalW, and refined manually. Sequences used for translation are described in Table I and the text. Residues highlighted in black are conserved in all proteins; those highlighted in gray are conserved in three or more of the proteins. Conserved amino acids are N/Q, D/E, R/K, S/T, F/W/Y, and A/G/L/M/V. Regions of high homology are marked with solid lines and numbered. Conserved Cys residues are marked with arrowheads. Conserved regions or amino acids that are specific for either domain 2 or domain 4 are indicated by letters.
Figure 3.
Figure 3.
Homologies of GAS28, GAS30, and GAS31 to extracellular matrix proteins of the volvocales family. Alignment of the N-terminal domains of GAS28, GAS30, and GAS31 (domain 2 in Fig. 1B) and the N-terminal regions of three proteins encoded by the Volvox pherophorin gene family: Pherophorin I precursor (Per1; accession no. P81131), Pherophorin II (Per2; accession no. P81132), and Sulfated surface glycoprotein 185 precursor (SSG_185; accession no. P21997). Conserved residues are highlighted and grouped as described in the legend of Figure 2. Lines mark conserved regions, and numbers refer to those used in Figure 2. Conserved Cys residues are marked with arrowheads.
Figure 4.
Figure 4.
Changes in the amounts of GAS28, GAS30, and GAS31 mRNAs during gametogenesis and after zygote formation. At time 0, the nitrogen source was removed from vegetatively growing cells. Incubation was continued in continuous light. Zygotes were generated by mixing mating-competent gametes of opposite mating types. Samples for RNA isolation were removed at the times indicated (h). Ten micrograms of total RNA per lane were loaded from gametes and 5 μg from zygotes. Northern-blot hybridizations were performed using probes specific for GAS28, GAS30, and GAS31 mRNAs as outlined in “Materials and Methods.” FUS1 served as a control for a gene expressed during gametogenesis but turned off upon zygote formation. A probe for HSP70B encoding a plastidic chaperone (Drzymalla et al., 1996) served as a loading control. The percentage of gametes or zygotes at each time point was determined as described in “Material and Methods” and is given below the autoradiograms. The percentage of zygotes was calculated from the number of quadriflagellate and biflagellate cells (Beck and Acker, 1992).
Figure 5.
Figure 5.
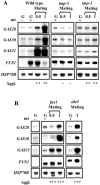
Analysis of GAS28, GAS30, and GAS31 expression in mutants unable to form zygotes. Gametes (G) of mating type + from the wild type and mutants were generated as described in “Materials and Methods” and mixed for 0.5 or 1 h with wild-type gametes of opposite mating type. Mating type + gametes from the wild type served as a control. Samples were taken for RNA isolation, and northern-blot hybridizations were performed using probes that are specific for GAS28, GAS30, and GAS31 transcripts. FUS1 expression was used as a molecular marker to monitor zygote formation since its mRNA disappears in young zygotes (Ferris et al., 1996). A probe for HSP70B served as a loading control. The agglutination reaction (Aggl.) was monitored in a semiquantitative manner: −, no agglutination; +++, strong agglutination. The mating type (mt) is indicated by + and −. A, Assay of a mutant defective in mating type + agglutinin (imp-5) and of a mutant deficient in the accumulation of cAMP (imp-3). B, Assay of fusion-defective mutants fus1 and ida5, both of which are mt+. The fus1 mutant has a deletion in the FUS1 gene, resulting in a smaller transcript (Ferris et al., 1996).
Figure 6.
Figure 6.
Changes in GAS28, GAS30, and GAS31 mRNA levels after gamete activation. Mature gametes were generated as described in “Materials and Methods.” The percentage of gametes is given below the autoradiograms. Northern-blot hybridizations were performed using probes for GAS28, GAS30, and GAS31 transcripts. CBLP encoding a Gβ-like polypeptide served as a loading control. A, Wild-type gametes of mating type plus were either not treated with isolated flagella (−) or treated for 1 h with isolated flagella from gametes of mating type minus (+). B, Wild-type gametes were treated with 10 mm db cAMP for the time indicated.
Figure 7.
Figure 7.
Effect of autolysin treatment on GAS28, GAS30, and GAS31 mRNA levels in gametes and in vegetative cells. At time 0, cells were treated with autolysin for different durations, and samples were taken for RNA isolation at the time points indicated. Northern-blot hybridizations were performed using probes that detect the GAS28, GAS30, and GAS31 transcripts. CBLP was used as a loading control. A, Gametes of the agglutinin + defective mutant imp-5, generated as described in “Materials and Methods.” B, Vegetative cells of the wild type (CC-124) grown in TAP medium.
Figure 8.
Figure 8.
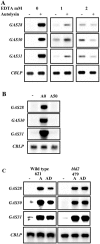
Treatments that affect the autolysin preparations. Vegetative cells were treated with autolysin preparations for 2 h before samples were removed for RNA isolation and northern-blot hybridizations performed using probes specific for the GAS28, GAS30, and GAS31 transcripts. CBLP was used as a loading control. A, Effect of autolysin in the presence or absence of EDTA. Wild-type cells grown in TAP medium were either treated with autolysin (+) or not (−). EDTA was added at the same time at the final concentrations indicated. B, Effect of autolysin that has been heat treated at 50°C for 10 min (A50). Expression levels were compared with nontreated autolysin (A0). Cells without autolysin treatment were used as control (−). C, Effect of dialyzes of autolysin. Autolysin was dialyzed overnight against TAP medium. Wild-type cells (CC-621) and flagellaless mutant bld2 (CC-479) grown in TAP medium were treated with dialyzed autolysin (AD), nondialyzed autolysin (A), or not treated (−).
Figure 9.
Figure 9.
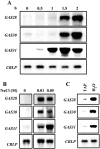
Changes in GAS28, GAS30, and GAS31 mRNA levels after a shift of vegetative cells to hyperosmotic and hypoosmotic conditions. Wild-type cells grown in TAP medium under continuous light were sedimented by centrifugation and resuspended in medium of different osmolarities. Northern-blot hybridizations were performed using probes that detected the GAS28, GAS30, and GAS31 transcripts. CBLP was used as a loading control. A, Kinetics of GAS28, GAS30, and GAS31 mRNA accumulation in cells shifted to TAP medium containing 0.2 m sorbitol (time 0). Samples for RNA isolation were taken at the time points indicated. B, Cells were shifted to TAP medium containing the NaCl concentrations indicated, and probes were taken after incubation for 2 h. C, Cells were resuspended in water and compared with cells resuspended in TAP medium. Samples for RNA isolation were taken after a treatment for 2 h.
Figure 10.
Figure 10.
Effect of autolysin treatment on GAS28, GAS30, and GAS31 mRNA levels under isosmotic conditions. Vegetative cells were treated either with autolysin (+) or without autolysin (−) for 2 h in TAP medium with different concentrations of sorbitol. Osmolarity of the medium is given in osmol (mOsM). Northern-blot hybridizations were performed using probes that detect the GAS28, GAS30, and GAS31 transcripts. CBLP was used as a loading control.
Figure 11.
Figure 11.
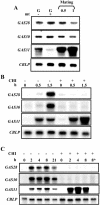
Consequences of inhibition of cytoplasmatic protein synthesis on GAS28, GAS30, and GAS31 mRNA levels in cells after zygote formation, after autolysin treatment, and after a shift to hyperosmotic conditions. Northern-blot hybridizations were performed using probes specific for the GAS28, GAS30, and GAS31 transcripts. CBLP served as a loading control. A, CHI treatment of gametes and of gametes during mating. Mature gametes of mating types + and − were generated as described in “Materials and Methods” and then suspended in nitrogen-free medium containing 10 μg/mL CHI for 30 min. These gametes were mixed for mating for 0.5 or 1 h, and samples were taken for RNA isolation. B, Influence of CHI on GAS28, GAS30, and GAS31 mRNA levels in vegetative cells treated with autolysin. Wild-type cells were incubated with 10 μg/mL CHI for 30 min prior to autolysin treatment (+) and compared to nontreated cells (−). Autolysin treatment started at time 0, and samples for RNA isolation were taken at the time points indicated. C, Effect of inhibition of cytoplasmatic protein synthesis on GAS gene expression in cells shifted to hyperosmotic conditions. Wild-type cells in TAP medium were either treated with 10 μg/mL CHI for 30 min (+) or not (−) prior to the addition of sorbitol (0.15 m final concentration). Cells were incubated for different durations (h). Sample 8* was treated for 8 h in TAP medium containing 10 μg/mL of CHI without sorbitol. Northern-blot hybridizations were performed as described in “Materials and Methods.”
Figure 12.
Figure 12.
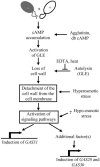
Model for the control of GAS28, GAS30, and GAS31 expression by endogenous and extrinsic signals. The adhesion reaction between mature gametes elicits an increase in intracellular cAMP levels, which in turn causes the activation of GLE. GLE catalyzes the degradation of the cell wall, which is proposed to lead to a signal that induces GAS28, GAS30, and GAS31.

Similar articles

Cited by

References

    1. Abe J, Kubo T, Takagi Y, Saito T, Miura K, Fukuzawa H, Matsuda Y (2004) The transcriptional program of synchronous gametogenesis in Chlamydomonas reinhardtii. Curr Genet 46: 304–315 - PubMed
    1. Adair WS, Apt KE (1990) Cell wall regeneration in Chlamydomonas: accumulation of mRNAs encoding cell wall hydroxyproline-rich glycoproteins. Proc Natl Acad Sci USA 87: 7355–7359 - PMC - PubMed
    1. Adair WS, Hwang C, Goodenough UW (1983) Identification and visualization of the sexual agglutinin from the mating-type plus flagellar membrane of Chlamydomonas. Cell 33: 183–193 - PubMed
    1. Alonso-Monge R, Real E, Wojda I, Bebelman J-P, Mager WH, Siderius M (2001) Hyperosmotic stress response and regulation of cell wall integrity in Saccharomyces cerevisiae share common functional aspects. Mol Microbiol 4: 717–730 - PubMed
    1. Barlow JJ, Mathias AP, Williamson R (1963) A simple method for the quantitative isolation of undegraded high molecular weight ribonucleic acid. Biochem Biophys Res Commun 13: 61–66 - PubMed

Publication types

MeSH terms

Associated data

LinkOut - more resources