. 2005 Oct;139(2):790-805.
doi: 10.1104/pp.105.065029. Epub 2005 Sep 23.

Early effects of salinity on water transport in Arabidopsis roots. Molecular and cellular features of aquaporin expression

Affiliations

Early effects of salinity on water transport in Arabidopsis roots. Molecular and cellular features of aquaporin expression

Yann Boursiac et al. Plant Physiol. 2005 Oct.

Abstract

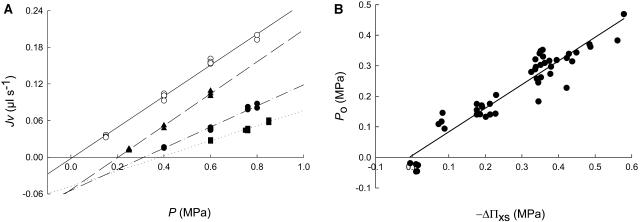
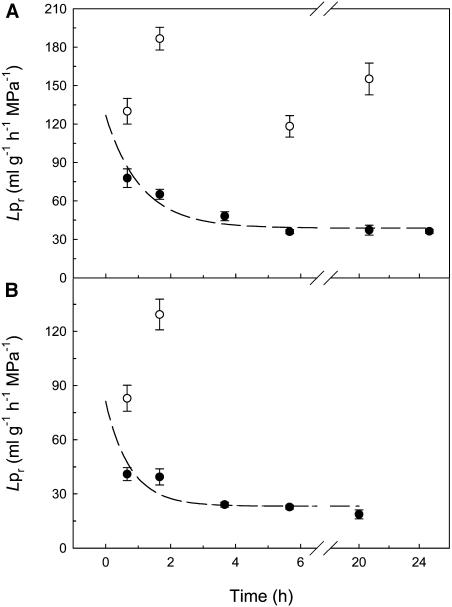
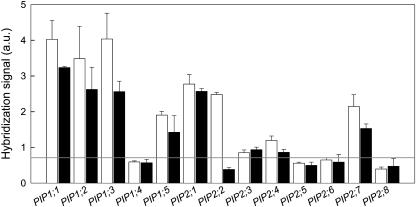
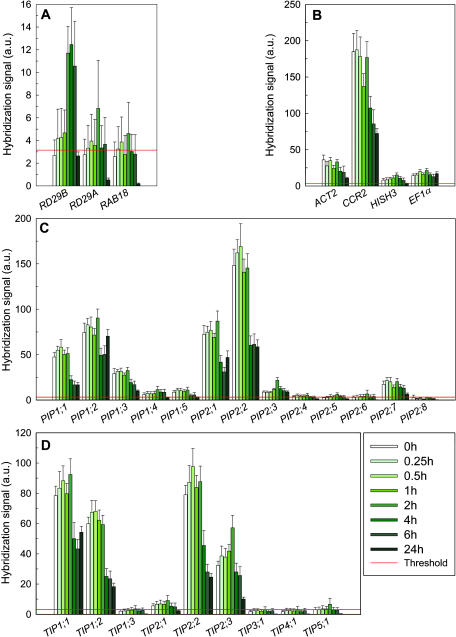
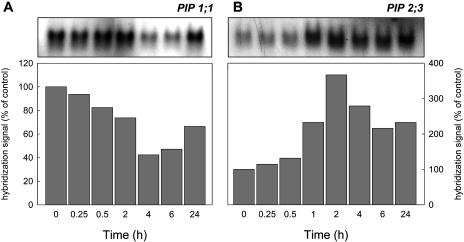
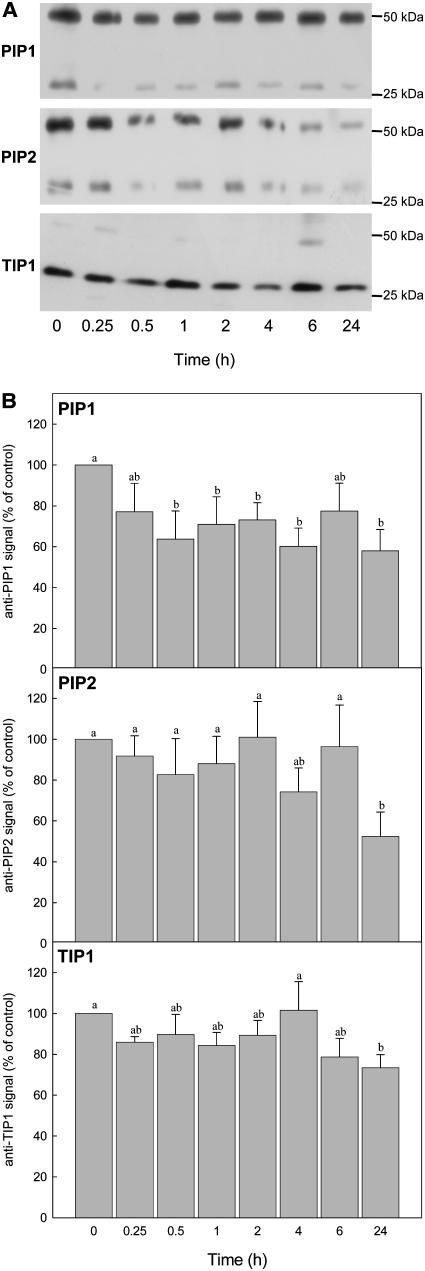
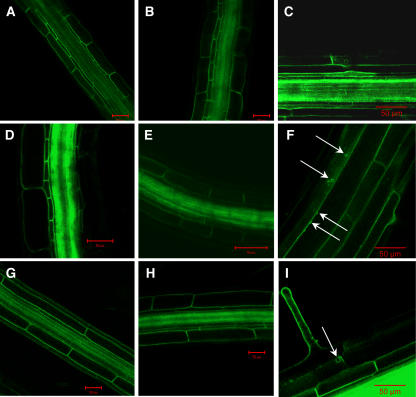
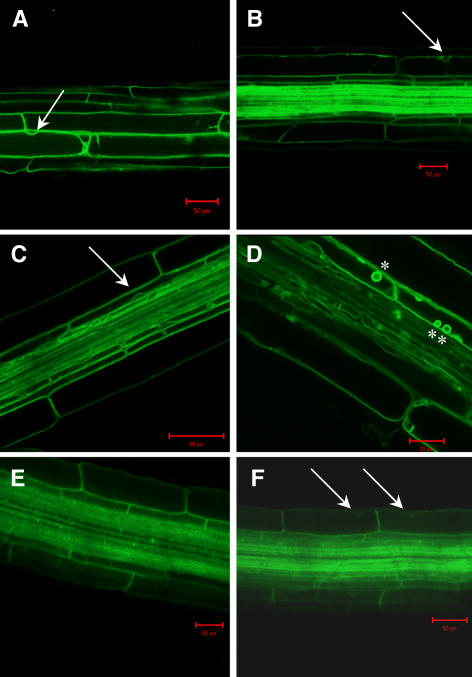
Aquaporins facilitate the uptake of soil water and mediate the regulation of root hydraulic conductivity (Lp(r)) in response to a large variety of environmental stresses. Here, we use Arabidopsis (Arabidopsis thaliana) plants to dissect the effects of salt on both Lp(r) and aquaporin expression and investigate possible molecular and cellular mechanisms of aquaporin regulation in plant roots under stress. Treatment of plants by 100 mm NaCl was perceived as an osmotic stimulus and induced a rapid (half-time, 45 min) and significant (70%) decrease in Lp(r), which was maintained for at least 24 h. Macroarray experiments with gene-specific tags were performed to investigate the expression of all 35 genes of the Arabidopsis aquaporin family. Transcripts from 20 individual aquaporin genes, most of which encoded members of the plasma membrane intrinsic protein (PIP) and tonoplast intrinsic protein (TIP) subfamilies, were detected in nontreated roots. All PIP and TIP aquaporin transcripts with a strong expression signal showed a 60% to 75% decrease in their abundance between 2 and 4 h following exposure to salt. The use of antipeptide antibodies that cross-reacted with isoforms of specific aquaporin subclasses revealed that the abundance of PIP1s decreased by 40% as early as 30 min after salt exposure, whereas PIP2 and TIP1 homologs showed a 20% to 40% decrease in abundance after 6 h of treatment. Expression in transgenic plants of aquaporins fused to the green fluorescent protein revealed that the subcellular localization of TIP2;1 and PIP1 and PIP2 homologs was unchanged after 45 min of exposure to salt, whereas a TIP1;1-green fluorescent protein fusion was relocalized into intracellular spherical structures tentatively identified as intravacuolar invaginations. The appearance of intracellular structures containing PIP1 and PIP2 homologs was occasionally observed after 2 h of salt treatment. In conclusion, this work shows that exposure of roots to salt induces changes in aquaporin expression at multiple levels. These changes include a coordinated transcriptional down-regulation and subcellular relocalization of both PIPs and TIPs. These mechanisms may act in concert to regulate root water transport, mostly in the long term (> or =6 h).


Figures

Figure 1.
Figure 1.
Pressure chamber measurements in roots of Arabidopsis plants treated with salt. A, Plants were grown for 1 h in a standard nutrient solution (○) or in a nutrient solution complemented with 50 mm NaCl (▴), 100 mm NaCl (•), or 150 mm NaCl (▪). Exuded sap flow rate (Jv) was measured on excised roots at the indicated pressure (P) in the same solution as that used to treat the plants. Pressure-to-flow relationships representative of each treatment are shown. Lpr (in mL g−1 h−1 MPa−1) can be deduced from the linear fit of Jv(P) curves and from the DW of corresponding root systems: ○, 148.0 ; ▴, 84.2 ; •, 62.1 ; ▪, 58.6. B, Relationship between the osmotic gradient present between xylem vessels and the root bathing solution (ΔΠx→s) and the balancing pressure P0. P0 was linearly extrapolated as the x-axis intercept of individual Jv(P) curves as shown in Figure 1A. For determining ΔΠx→s, sap was collected in roots during the course of Lpr measurements (see “Materials and Methods”). The graph presents combined data from measurements on roots from individual plants treated with a standard nutrient solution (n = 5) or with a nutrient solution complemented with 25 mm NaCl (n = 4), 50 mm NaCl (n = 11), 100 mm NaCl (n = 16), or 150 mm NaCl (n = 16).
Figure 2.
Figure 2.
Kinetic changes of Lpr induced by salt in wild-type (A) and sos2-1 (B) plants. A, Wild-type plants were transferred at time 0 in a fresh standard nutrient solution (○) or in a nutrient solution complemented with 100 mm NaCl (•). Times of treatment include the 30 to 40 min required to adjust the excised root in the pressure chamber. Lpr was measured as exemplified in Figure 1A. The broken line represents an exponential fit of Lpr values in salt-treated plants assuming that Lpr at the initial time was similar to the value measured at 1 h in untreated controls. B, Measurements on sos2-1 plants, with the same procedure and conventions as in A.
Figure 3.
Figure 3.
Expression profiling of PIP genes in roots of wild-type and PIP2;2 knockout Arabidopsis (ecotype Wassilewskija) lines. Representative macroarray hybridization experiment using complex probes prepared from roots of wild-type plants (white bars) or from roots of a T-DNA insertion PIP2;2 mutant (pip2;2-2 line; black bars). The alterations in water transport displayed at the cell and root levels by the pip2;2-2 mutant were described in a previous work (Javot et al., 2003). Signals (in arbitrary units, ±sd) from three independent membranes were averaged for each plant line and results from GSTs of the PIP subfamily only are shown. Because all manipulations were run in parallel, no normalization of the hybridization signals between the two genotypes was required for comparison. The hatched line indicates the mean level of unspecific hybridization signals + 2 sd (see description of negative controls in “Materials and Methods”) and corresponds to the threshold above which a signal is considered as significantly over background. Note that GSTs for pairs of very close aquaporin homologs (i.e. PIP1;3/PIP1;4 or PIP2;2/PIP2;3) yield very distinct hybridization signals, suggesting that there was no cross-hybridization.
Figure 4.
Figure 4.
Kinetics of gene expression in wild-type roots treated with 100 mm NaCl. RNA was extracted from roots collected at the indicated time after treatment of plants with 100 mm NaCl. Macroarray hybridization data (in arbitrary units, ±se; n = 6) were obtained from three independent salt treatments, each being analyzed in two complete probe-labeling and hybridization experiments. Data from the six individual hybridization experiments were combined, as described in “Materials and Methods,” using a normalization procedure based on comparison of hybridization signals at initial time points. The red line indicates the threshold, similar in all images, above which a signal is considered as significantly over background (see Fig. 3). A, Signals from abiotic stress-regulated genes (see “Materials and Methods” for references). B, Signals from ACT2, CCR2, histone H3, and EF1-α. C, Signals from members of the PIP subfamily. D, Signals from members of the TIP subfamily.
Figure 5.
Figure 5.
Northern-blot analysis of salt-dependent aquaporin gene expression in the Arabidopsis root. RNA samples extracted from roots and pooled from the three independent kinetic experiments described in Figure 4 were analyzed using the PIP1;1 (A) or the PIP2;3 (B) GST as a probe. The time after treatment of plants with 100 mm NaCl is indicated. For each gene, a representative autoradiograph obtained after membrane hybridization is shown (top). For each time point, the aquaporin hybridization signal was normalized with respect to a 25S rRNA hybridization signal (data not shown) and is expressed as a percentage of the aquaporin hybridization signal at the initial time (bottom). Macroarrays revealed that gene expression profiles could vary slightly between independent biological experiments. For instance, in one of three experiments, there was a clear increase in PIP1;1 mRNA levels after 24 h. Because the combination of mRNA samples for northern blots and the combination of hybridization signals from independent macroarray experiments relied on different parameters (i.e. mRNA abundance and hybridization signal intensity, respectively), the average response may vary slightly between the two approaches. This could explain discrepancies at certain time points.
Figure 6.
Figure 6.
Time-dependent changes in aquaporin abundance in roots of salt-treated plants. A, Total proteins were extracted from roots collected at the indicated time after treatment with 100 mm NaCl. Typical western blots (5 μg protein/lane) for probing the abundance of proteins immunoreactive to an anti-PIP1 antibody (PIP1), an anti-PIP2 antibody (PIP2), or an anti-TIP1 antibody (TIP1) are shown. B, ELISA assays on total protein extracts, using the antibodies described above (same conventions). Values for each sample were compared to, and expressed as a percentage of, the control value at t = 0. Data (±se, n = 6) from six individual ELISA assays with samples from two independent salt treatments were combined. Letters above bars indicate statistically significant (P < 0.05) values between time points.
Figure 7.
Figure 7.
Effects of salinity on subcellular localization of PIPs fused to GFP. The figure shows laser-scanning confocal micrographs of the fluorescence emitted by root cells of transgenic plants grown in hydroponic culture. Observations were made 45 min after transfer of plants in a standard nutrient solution (A, D, and G), 45 min (B, E, and H), or 120 min (C, F, and I) after transfer in a nutrient solution complemented with 100 mm NaCl. Plants expressed the following fusion proteins: GFP-LTP (A–C), PIP1;1-GFP (D–F), or PIP2;1-GFP (G–I). Arrows indicate intracellular structures occasionally observed with all GFP fusion proteins after 120 min of treatment. Scale bar, 50 μm.
Figure 8.
Figure 8.
Effects of salinity on subcellular localization of TIPs fused to GFP. Observations were made 45 min after transfer of plants in a nutrient solution either standard (A, C, and E) or complemented with 100 mm NaCl (B, D, and F). Plants expressed the following fusion proteins: AtNRAMP3-GFP (A and B), TIP1;1-GFP (C and D), and TIP2;1-GFP (E and F). Note nuclei skirted by labeling of the TP (arrows) by AtNRAMP3-GFP (A and B), TIP1;1-GFP (C), and TIP2;1-GFP (F). Labeling of vacuolar bulbs (asterisks) is specific to salt-treated roots expressing TIP1;1-GFP (D). Scale bar, 50 μm.

Similar articles

Cited by

References

    1. Aroca R, Amodeo G, Fernandez-Illescas S, Herman EM, Chaumont F, Chrispeels MJ (2005) The role of aquaporins and membrane damage in chilling and hydrogen peroxide induced changes in the hydraulic conductance of maize roots. Plant Physiol 137: 341–353 - PMC - PubMed
    1. Asamizu E, Nakamura Y, Sato S, Tabata S (2000) A large scale analysis of cDNA in Arabidopsis thaliana: generation of 12,028 non-redundant expressed sequence tags from normalized and size-selected cDNA libraries. DNA Res 7: 175–180 - PubMed
    1. Azaizeh H, Steudle E (1991) Effects of salinity on water transport of excised maize (Zea mays L.) roots. Plant Physiol 97: 1136–1145 - PMC - PubMed
    1. Barkla BJ, Vera-Estrella R, Pantoja O, Kirch HH, Bohnert HJ (1999) Aquaporin localization—how valid are the TIP and PIP labels? Trends Plant Sci 4: 86–88 - PubMed
    1. Bernard K, Auphan N, Granjeaud S, Victorero G, Schmitt-Verhulst AM, Jordan BR, Nguyen C (1996) Multiplex messenger assay: simultaneous, quantitative measurement of expression of many genes in the context of T cell activation. Nucleic Acids Res 24: 1435–1442 - PMC - PubMed

Publication types

MeSH terms

LinkOut - more resources