

Changes in transcriptional profiles are associated with early fruit tissue specialization in tomato
- PMID: 16183847
- PMCID: PMC1255993
- DOI: 10.1104/pp.105.063719
Changes in transcriptional profiles are associated with early fruit tissue specialization in tomato
Abstract
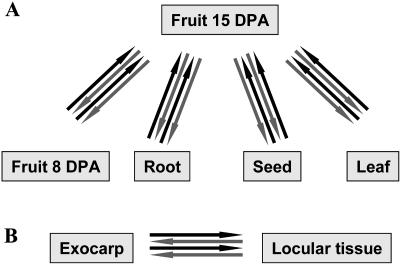
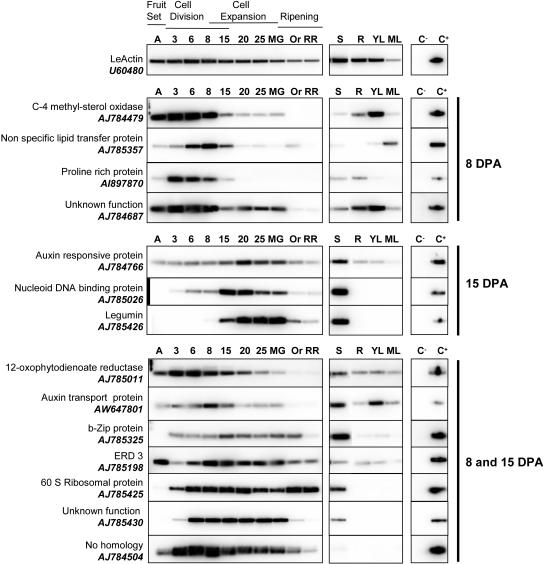
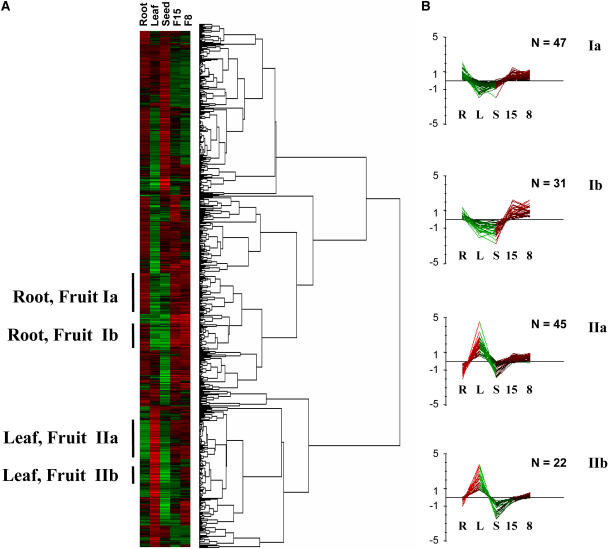
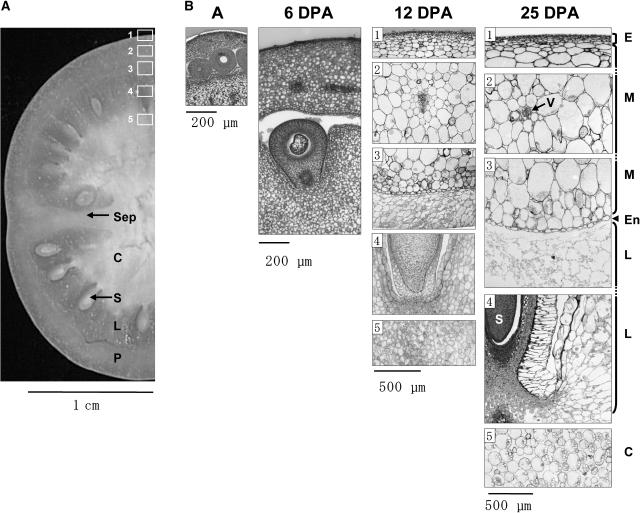
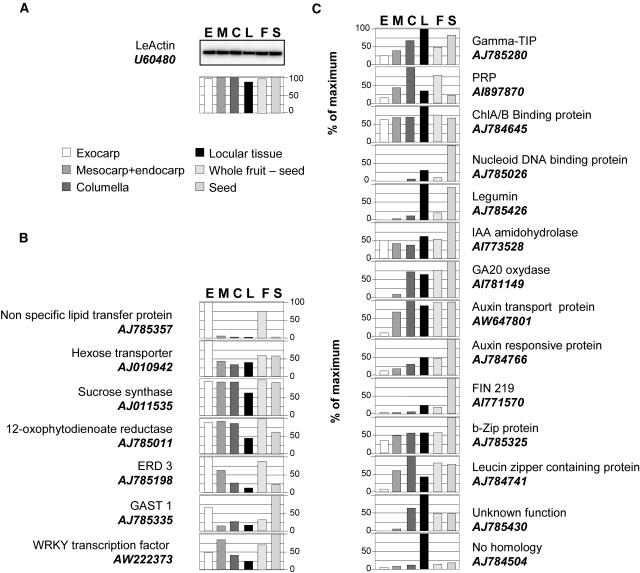
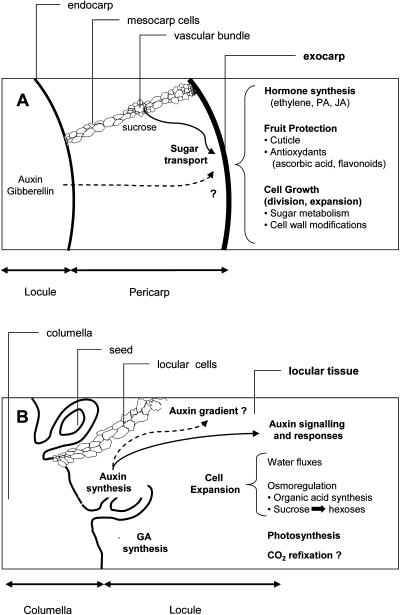
The cell expansion phase contributes in determining the major characteristics of a fleshy fruit and represents two-thirds of the total fruit development in tomato (Solanum lycopersicum). So far, it has received very little attention. To evaluate the interest of a genomic scale approach, we performed an initial sequencing of approximately 1,200 cell expansion stage-related sequence tags from tomato fruit at 8, 12, and 15 d post anthesis. Interestingly, up to approximately 35% of the expressed sequence tags showed no homology with available tomato expressed sequence tags and up to approximately 21% with any known gene. Microarrays spotted with expansion phase-related cDNAs and other fruit cDNAs involved in various developmental processes were used (1) to profile gene expression in developing fruit and other plant organs and (2) to compare two growing fruit tissues engaged mostly in cell division (exocarp) or in cell expansion (locular tissue surrounding the seeds). Reverse transcription-polymerase chain reaction analysis was further used to confirm microarray results and to specify expression profiles of selected genes (24) in various tissues from expanding fruit. The wide range of genes expressed in the exocarp is consistent with a protective function and with a high metabolic activity of this tissue. In addition, our data show that the expansion of locular cells is concomitant with the expression of genes controlling water flow, organic acid synthesis, sugar storage, and photosynthesis and suggest that hormones (auxin and gibberellin) regulate this process. The data presented provide a basis for tissue-specific analyses of gene function in growing tomato fruit.
Figures
Similar articles
-
Gene and metabolite regulatory network analysis of early developing fruit tissues highlights new candidate genes for the control of tomato fruit composition and development.Plant Physiol. 2009 Mar;149(3):1505-28. doi: 10.1104/pp.108.133967. Epub 2009 Jan 14. Plant Physiol. 2009. PMID: 19144766 Free PMC article.
-
Down-regulation of a single auxin efflux transport protein in tomato induces precocious fruit development.J Exp Bot. 2012 Aug;63(13):4901-17. doi: 10.1093/jxb/ers167. Epub 2012 Jul 27. J Exp Bot. 2012. PMID: 22844095 Free PMC article.
-
Evaluating auxin distribution in tomato (Solanum lycopersicum) through an analysis of the PIN and AUX/LAX gene families.Plant J. 2012 May;70(4):585-98. doi: 10.1111/j.1365-313X.2011.04895.x. Epub 2012 Feb 10. Plant J. 2012. PMID: 22211518
-
The role of auxin and gibberellin in tomato fruit set.J Exp Bot. 2009;60(5):1523-32. doi: 10.1093/jxb/erp094. Epub 2009 Mar 25. J Exp Bot. 2009. PMID: 19321650 Review.
-
Fruit growth-related genes in tomato.J Exp Bot. 2015 Feb;66(4):1075-86. doi: 10.1093/jxb/eru527. Epub 2015 Jan 7. J Exp Bot. 2015. PMID: 25573859 Review.
Cited by
-
Tissue- and cell-type specific transcriptome profiling of expanding tomato fruit provides insights into metabolic and regulatory specialization and cuticle formation.Plant Cell. 2011 Nov;23(11):3893-910. doi: 10.1105/tpc.111.091173. Epub 2011 Nov 1. Plant Cell. 2011. PMID: 22045915 Free PMC article.
-
Expression profile analysis of early fruit development in iaaM-parthenocarpic tomato plants.BMC Res Notes. 2009 Jul 21;2:143. doi: 10.1186/1756-0500-2-143. BMC Res Notes. 2009. PMID: 19619340 Free PMC article.
-
Cell type-specific transcriptional profiling: implications for metabolite profiling.Plant J. 2012 Apr;70(1):5-17. doi: 10.1111/j.1365-313X.2012.04888.x. Plant J. 2012. PMID: 22449039 Free PMC article. Review.
-
Remarkable reproducibility of enzyme activity profiles in tomato fruits grown under contrasting environments provides a roadmap for studies of fruit metabolism.Plant Physiol. 2014 Mar;164(3):1204-21. doi: 10.1104/pp.113.231241. Epub 2014 Jan 28. Plant Physiol. 2014. PMID: 24474652 Free PMC article.
-
Spatiotemporal dynamics of the tomato fruit transcriptome under prolonged water stress.Plant Physiol. 2022 Nov 28;190(4):2557-2578. doi: 10.1093/plphys/kiac445. Plant Physiol. 2022. PMID: 36135793 Free PMC article.
References
-
- Alba R, Fei Z, Payton P, Liu Y, Moore SL, Debbie P, Cohn J, D'Ascenzo M, Gordon JS, Rose JK, et al (2004) ESTs, cDNA microarrays, and gene expression profiling: tools for dissecting plant physiology and development. Plant J 39: 697–714 - PubMed
-
- Baxter CJ, Carrari F, Bauke A, Overy S, Hill SA, Quick P, Fernie AR, Sweetlove LJ (2005) Fruit carbohydrate metabolism in an introgression line of tomato with increased fruit soluble solids. Plant Cell Physiol 46: 425–437 - PubMed
-
- Benkova E, Michniewicz M, Sauer M, Teichmann T, Seifertova D, Jurgens G, Friml J (2003) Local, efflux-dependent auxin gradients as a common module for plant organ formation. Cell 26: 591–602 - PubMed
Publication types
MeSH terms
Substances
Associated data
- Actions
- Actions
- Actions
- Actions
- Actions
- Actions
- Actions
- Actions
- Actions
- Actions
- Actions
- Actions
- Actions
- Actions
- Actions
- Actions
- Actions
- Actions
- Actions
- Actions
- Actions
- Actions
- Actions
- Actions
- Actions
- Actions
- Actions
- Actions
- Actions
- Actions
- Actions
- Actions
- Actions
- Actions
- Actions
- Actions
- Actions
- Actions
- Actions
- Actions
- Actions
- Actions
- Actions
- Actions
- Actions
- Actions
- Actions
- Actions
- Actions
- Actions
- Actions
- Actions
- Actions
- Actions
- Actions
- Actions
- Actions
- Actions
- Actions
- Actions
- Actions
- Actions
- Actions
- Actions
- Actions
- Actions
- Actions
- Actions
- Actions
- Actions
- Actions
- Actions
- Actions
- Actions
- Actions
- Actions
- Actions
- Actions
- Actions
- Actions
- Actions
- Actions
- Actions
- Actions
- Actions
- Actions
- Actions
- Actions
- Actions
- Actions
- Actions
- Actions
- Actions
- Actions
- Actions
- Actions
- Actions
- Actions
- Actions
- Actions
- Actions
- Actions
- Actions
- Actions
- Actions
- Actions
- Actions
- Actions
- Actions
- Actions
- Actions
- Actions
- Actions
- Actions
- Actions
- Actions
- Actions
- Actions
- Actions
- Actions
- Actions
- Actions
- Actions
- Actions
- Actions
- Actions
- Actions
- Actions
- Actions
- Actions
- Actions
- Actions
- Actions
- Actions
- Actions
- Actions
- Actions
- Actions
- Actions
- Actions
- Actions
- Actions
- Actions
- Actions
- Actions
- Actions
- Actions
- Actions
- Actions
- Actions
- Actions
- Actions
- Actions
- Actions
- Actions
- Actions
- Actions
- Actions
- Actions
- Actions
- Actions
- Actions
- Actions
- Actions
- Actions
- Actions
- Actions
- Actions
- Actions
- Actions
- Actions
- Actions
- Actions
- Actions
- Actions
- Actions
- Actions
- Actions
- Actions
- Actions
- Actions
- Actions
- Actions
- Actions
- Actions
- Actions
- Actions
- Actions
- Actions
- Actions
- Actions
- Actions
- Actions
- Actions
- Actions
- Actions
- Actions
- Actions
- Actions
- Actions
- Actions
- Actions
- Actions
- Actions
- Actions
- Actions
- Actions
- Actions
- Actions
- Actions
- Actions
- Actions
- Actions
- Actions
- Actions
- Actions
- Actions
- Actions
- Actions
- Actions
- Actions
- Actions
- Actions
- Actions
- Actions
- Actions
- Actions
- Actions
- Actions
- Actions
- Actions
- Actions
- Actions
- Actions
- Actions
- Actions
- Actions
- Actions
- Actions
- Actions
- Actions
- Actions
- Actions
- Actions
- Actions
- Actions
- Actions
- Actions
- Actions
- Actions
- Actions
- Actions
- Actions
- Actions
- Actions
- Actions
- Actions
- Actions
- Actions
- Actions
- Actions
- Actions
- Actions
- Actions
- Actions
- Actions
- Actions
- Actions
- Actions
- Actions
- Actions
- Actions
- Actions
- Actions
- Actions
- Actions
- Actions
- Actions
- Actions
- Actions
- Actions
- Actions
- Actions
- Actions
- Actions
- Actions
- Actions
- Actions
- Actions
- Actions
- Actions
- Actions
- Actions
- Actions
- Actions
- Actions
- Actions
- Actions
- Actions
- Actions
- Actions
- Actions
- Actions
- Actions
- Actions
- Actions
- Actions
- Actions
- Actions
- Actions
- Actions
- Actions
- Actions
- Actions
- Actions
- Actions
- Actions
- Actions
- Actions
- Actions
- Actions
- Actions
- Actions
- Actions
- Actions
- Actions
- Actions
- Actions
- Actions
- Actions
- Actions
- Actions
- Actions
- Actions
- Actions
- Actions
- Actions
- Actions
- Actions
- Actions
- Actions
- Actions
- Actions
- Actions
- Actions
- Actions
- Actions
- Actions
- Actions
- Actions
- Actions
- Actions
- Actions
- Actions
- Actions
- Actions
- Actions
- Actions
- Actions
- Actions
- Actions
- Actions
- Actions
- Actions
- Actions
- Actions
- Actions
- Actions
- Actions
- Actions
- Actions
- Actions
- Actions
- Actions
- Actions
- Actions
- Actions
- Actions
- Actions
- Actions
- Actions
- Actions
- Actions
- Actions
- Actions
- Actions
- Actions
- Actions
- Actions
- Actions
- Actions
- Actions
- Actions
- Actions
- Actions
- Actions
- Actions
- Actions
- Actions
- Actions
- Actions
- Actions
- Actions
- Actions
- Actions
- Actions
- Actions
- Actions
- Actions
- Actions
- Actions
- Actions
- Actions
- Actions
- Actions
- Actions
- Actions
- Actions
- Actions
- Actions
- Actions
- Actions
- Actions
- Actions
- Actions
- Actions
- Actions
- Actions
- Actions
- Actions
- Actions
- Actions
- Actions
- Actions
- Actions
- Actions
- Actions
- Actions
- Actions
- Actions
- Actions
- Actions
- Actions
- Actions
- Actions
- Actions
- Actions
- Actions
- Actions
- Actions
- Actions
- Actions
- Actions
- Actions
- Actions
- Actions
- Actions
- Actions
- Actions
- Actions
- Actions
- Actions
- Actions
- Actions
- Actions
- Actions
- Actions
- Actions
- Actions
- Actions
- Actions
- Actions
- Actions
- Actions
- Actions
- Actions
- Actions
- Actions
- Actions
- Actions
- Actions
- Actions
- Actions
- Actions
- Actions
- Actions
- Actions
- Actions
- Actions
- Actions
- Actions
- Actions
- Actions
- Actions
- Actions
- Actions
- Actions
- Actions
- Actions
- Actions
- Actions
- Actions
- Actions
- Actions
- Actions
- Actions
- Actions
- Actions
- Actions
- Actions
- Actions
- Actions
- Actions
- Actions
- Actions
- Actions
- Actions
- Actions
- Actions
- Actions
- Actions
- Actions
- Actions
- Actions
- Actions
- Actions
- Actions
- Actions
- Actions
- Actions
- Actions
- Actions
- Actions
- Actions
- Actions
- Actions
- Actions
- Actions
- Actions
- Actions
- Actions
- Actions
- Actions
- Actions
- Actions
- Actions
- Actions
- Actions
- Actions
- Actions
- Actions
- Actions
- Actions
- Actions
- Actions
- Actions
- Actions
- Actions
- Actions
- Actions
- Actions
- Actions
- Actions
- Actions
- Actions
- Actions
- Actions
- Actions
- Actions
- Actions
- Actions
- Actions
- Actions
- Actions
- Actions
- Actions
- Actions
- Actions
- Actions
- Actions
- Actions
- Actions
- Actions
- Actions
- Actions
- Actions
- Actions
- Actions
- Actions
- Actions
- Actions
- Actions
- Actions
- Actions
- Actions
- Actions
- Actions
- Actions
- Actions
- Actions
- Actions
- Actions
- Actions
- Actions
- Actions
- Actions
- Actions
- Actions
- Actions
- Actions
- Actions
- Actions
- Actions
- Actions
- Actions
- Actions
- Actions
- Actions
- Actions
- Actions
- Actions
- Actions
- Actions
- Actions
- Actions
- Actions
- Actions
- Actions
- Actions
- Actions
- Actions
- Actions
- Actions
- Actions
- Actions
- Actions
- Actions
- Actions
- Actions
- Actions
- Actions
- Actions
- Actions
- Actions
- Actions
- Actions
- Actions
- Actions
- Actions
- Actions
- Actions
- Actions
- Actions
- Actions
- Actions
- Actions
- Actions
- Actions
- Actions
- Actions
- Actions
- Actions
- Actions
- Actions
- Actions
- Actions
- Actions
- Actions
- Actions
- Actions
- Actions
- Actions
- Actions
- Actions
- Actions
- Actions
- Actions
- Actions
- Actions
- Actions
- Actions
- Actions
- Actions
- Actions
- Actions
- Actions
- Actions
- Actions
- Actions
- Actions
- Actions
- Actions
- Actions
- Actions
- Actions
- Actions
- Actions
- Actions
- Actions
- Actions
- Actions
- Actions
- Actions
- Actions
- Actions
- Actions
- Actions
- Actions
- Actions
- Actions
- Actions
- Actions
- Actions
- Actions
- Actions
- Actions
- Actions
- Actions
- Actions
- Actions
- Actions
- Actions
- Actions
- Actions
- Actions
- Actions
- Actions
- Actions
- Actions
- Actions
- Actions
- Actions
- Actions
- Actions
- Actions
- Actions
- Actions
- Actions
- Actions
- Actions
- Actions
- Actions
- Actions
- Actions
- Actions
- Actions
- Actions
- Actions
- Actions
- Actions
- Actions
- Actions
- Actions
- Actions
- Actions
- Actions
- Actions
- Actions
- Actions
- Actions
- Actions
- Actions
- Actions
- Actions
- Actions
- Actions
- Actions
- Actions
- Actions
- Actions
- Actions
- Actions
- Actions
- Actions
- Actions
- Actions
- Actions
- Actions
- Actions
- Actions
- Actions
- Actions
- Actions
- Actions
- Actions
- Actions
- Actions
- Actions
- Actions
- Actions
- Actions
- Actions
- Actions
- Actions
- Actions
- Actions
- Actions
- Actions
- Actions
- Actions
- Actions
- Actions
- Actions
- Actions
- Actions
- Actions
- Actions
- Actions
- Actions
- Actions
- Actions
- Actions
- Actions
- Actions
- Actions
- Actions
- Actions
- Actions
- Actions
- Actions
- Actions
- Actions
- Actions
- Actions
- Actions
- Actions
- Actions
- Actions
- Actions
- Actions
- Actions
- Actions
- Actions
- Actions
- Actions
- Actions
- Actions
- Actions
- Actions
- Actions
- Actions
- Actions
- Actions
- Actions
- Actions
- Actions
- Actions
- Actions
- Actions
- Actions
- Actions
- Actions
- Actions
- Actions
- Actions
- Actions
- Actions
- Actions
- Actions
- Actions
- Actions
- Actions
- Actions
- Actions
- Actions
- Actions
- Actions
- Actions
- Actions
- Actions
- Actions
- Actions
- Actions
- Actions
- Actions
- Actions
- Actions
- Actions
- Actions
- Actions
- Actions
- Actions
- Actions
- Actions
- Actions
- Actions
- Actions
- Actions
- Actions
- Actions
- Actions
- Actions
- Actions
- Actions
- Actions
- Actions
- Actions
- Actions
- Actions
- Actions
- Actions
- Actions
- Actions
- Actions
- Actions
- Actions
- Actions
- Actions
- Actions
- Actions
- Actions
- Actions
- Actions
- Actions
- Actions
- Actions
- Actions
- Actions
- Actions
- Actions
- Actions
- Actions
- Actions
- Actions
- Actions
- Actions
- Actions
- Actions
- Actions
- Actions
- Actions
- Actions
- Actions
- Actions
- Actions
- Actions
- Actions
- Actions
- Actions
- Actions
- Actions
- Actions
- Actions
- Actions
- Actions
- Actions
- Actions
- Actions
- Actions
- Actions
- Actions
- Actions
- Actions
- Actions
- Actions
- Actions
- Actions
- Actions
- Actions
- Actions
- Actions
- Actions
- Actions
- Actions
- Actions
- Actions
- Actions
- Actions
- Actions
- Actions
- Actions
- Actions
- Actions
- Actions
- Actions
- Actions
- Actions
- Actions
- Actions
- Actions
- Actions
- Actions
- Actions
- Actions
- Actions
- Actions
- Actions
- Actions
- Actions
- Actions
- Actions
- Actions
- Actions
- Actions
- Actions
- Actions
- Actions
- Actions
- Actions
- Actions
LinkOut - more resources
Full Text Sources
Other Literature Sources
