A molecular dynamics study of the response of lipid bilayers and monolayers to trehalose
- PMID: 16183878
- PMCID: PMC1366976
- DOI: 10.1529/biophysj.105.065953
A molecular dynamics study of the response of lipid bilayers and monolayers to trehalose
Abstract
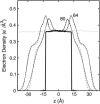
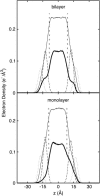
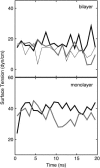
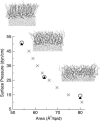
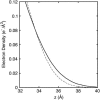
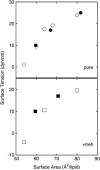
Surface tensions evaluated from molecular dynamics simulations of fully hydrated dipalmitoylphosphatidylcholine bilayers and monolayers at surface areas/lipid of 54, 64, and 80 A2 are uniformly lowered 4-8 dyn/cm upon addition of trehalose in a 1:2 trehalose/lipid ratio. Constant surface tension simulations of bilayers yield the complementary result: an increase in surface area consistent with the surface pressure-surface area (pi-A) isotherms. Hydrogen bonding by trehalose, replacement of waters in the headgroup region, and modulation of the dipole potential are all similar in bilayers and monolayers at the same surface area. These results strongly support the assumption that experimental measurements on the interactions of surface active components such as trehalose with monolayers can yield quantitative insight to their effects on bilayers. The simulations also indicate that the 20-30 dyn/cm difference in surface tension of the bilayer leaflet and monolayer arises from differences in the chain regions, not the headgroup/water interfaces.
Figures





Similar articles
-
Molecular dynamics simulation study of the interaction of trehalose with lipid membranes.Langmuir. 2004 Aug 31;20(18):7844-51. doi: 10.1021/la049485l. Langmuir. 2004. PMID: 15323539
-
Molecular simulation study of phospholipid bilayers and insights of the interactions with disaccharides.Biophys J. 2003 Nov;85(5):2830-44. doi: 10.1016/s0006-3495(03)74706-7. Biophys J. 2003. PMID: 14581188 Free PMC article.
-
Molecular dynamics study on the stabilization of dehydrated lipid bilayers with glucose and trehalose.J Phys Chem B. 2008 Aug 28;112(34):10732-40. doi: 10.1021/jp8025489. Epub 2008 Aug 5. J Phys Chem B. 2008. PMID: 18680361
-
Molecular dynamics simulation of hydrated phospholipid bilayers.Indian J Biochem Biophys. 1996 Dec;33(6):431-47. Indian J Biochem Biophys. 1996. PMID: 9219427 Review.
-
Leaflet Tensions Control the Spatio-Temporal Remodeling of Lipid Bilayers and Nanovesicles.Biomolecules. 2023 May 31;13(6):926. doi: 10.3390/biom13060926. Biomolecules. 2023. PMID: 37371505 Free PMC article. Review.
Cited by
-
Comparing experimental and simulated pressure-area isotherms for DPPC.Biophys J. 2008 Apr 15;94(8):2965-86. doi: 10.1529/biophysj.107.114215. Epub 2008 Jan 16. Biophys J. 2008. PMID: 18199666 Free PMC article.
-
Protective effect of trehalose sugar on amyloid-membrane interactions using BLM electrophysiology.Biophys J. 2024 Jun 18;123(12):1690-1704. doi: 10.1016/j.bpj.2024.05.012. Epub 2024 May 15. Biophys J. 2024. PMID: 38751113 Free PMC article.
-
Long-range Lennard-Jones and electrostatic interactions in interfaces: application of the isotropic periodic sum method.J Phys Chem B. 2007 May 3;111(17):4393-400. doi: 10.1021/jp068767m. Epub 2007 Apr 11. J Phys Chem B. 2007. PMID: 17425357 Free PMC article.
-
Reparameterization of all-atom dipalmitoylphosphatidylcholine lipid parameters enables simulation of fluid bilayers at zero tension.Biophys J. 2007 Jun 15;92(12):4157-67. doi: 10.1529/biophysj.106.087130. Epub 2007 Mar 30. Biophys J. 2007. PMID: 17400696 Free PMC article.
-
Effect of the cosolutes trehalose and methanol on the equilibrium and phase-transition properties of glycerol-monopalmitate lipid bilayers investigated using molecular dynamics simulations.Eur Biophys J. 2014 Nov;43(10-11):517-44. doi: 10.1007/s00249-014-0982-9. Epub 2014 Aug 24. Eur Biophys J. 2014. PMID: 25150983
References
-
- Wolkers, W. F., N. J. Walker, Y. Tamari, F. Tablin, and J. H. Crowe. 2003. Towards a clinical application of freeze-dried human platelets. Cell Preservation Technology. 1:175–188.
-
- Karger. Basel. 1992. Biological Product Freeze-Drying and Formulation, Developments in Biological Standardization, Vol. 74. J. C. May and F. Brown, editors. S. Karger Publishers, Basel, Switzerland. - PubMed
-
- Crowe, J. H., M. A. Whittam, D. Chapman, and L. M. Crowe. 1984. Interactions of phospholipid monolayers with carbohydrates. Biochim. Biophys. Acta. 769:151–159. - PubMed
-
- Diaz, S., F. Lairión, J. Arroyo, A. C. Biondi de Lopez, and E. A. Disalvo. 2001. Contribution of phosphate groups to the dipole potential of dimyristoylphosphatidycholine membranes. Langmuir. 17:852–855.
MeSH terms
Substances
LinkOut - more resources
Full Text Sources
Other Literature Sources
Research Materials
Miscellaneous

