

The influence of amino acid protonation states on molecular dynamics simulations of the bacterial porin OmpF
- PMID: 16183883
- PMCID: PMC1367011
- DOI: 10.1529/biophysj.105.059329
The influence of amino acid protonation states on molecular dynamics simulations of the bacterial porin OmpF
Abstract
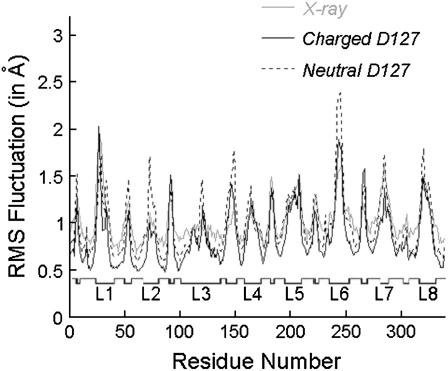
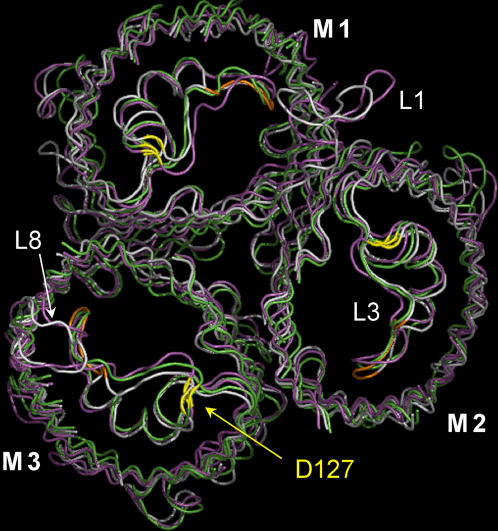
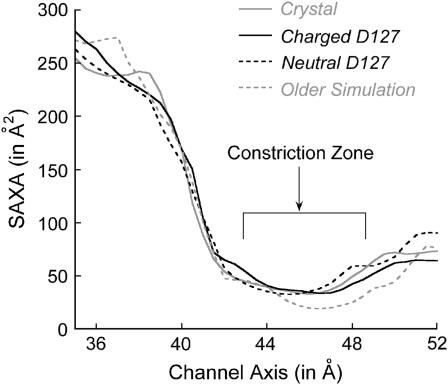
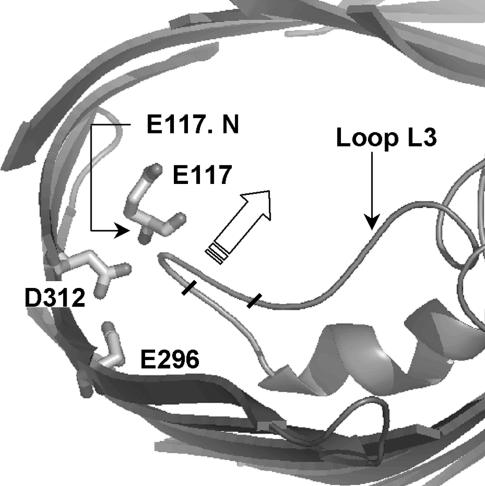
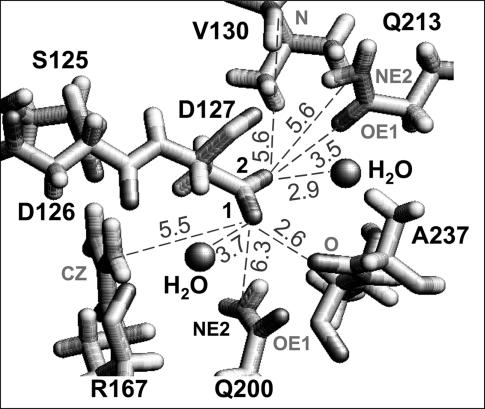
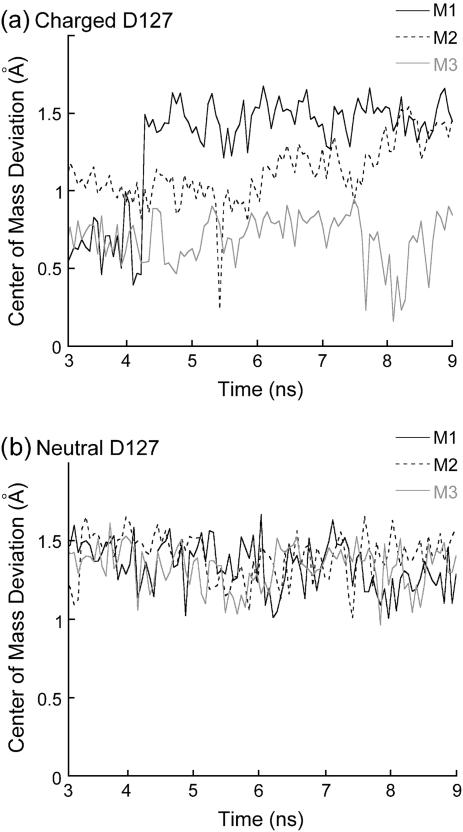
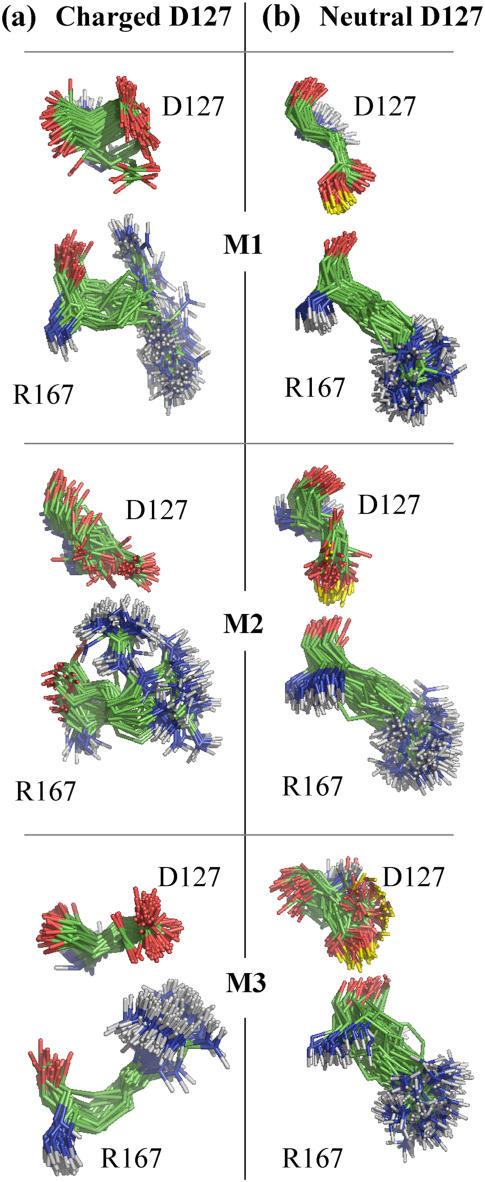
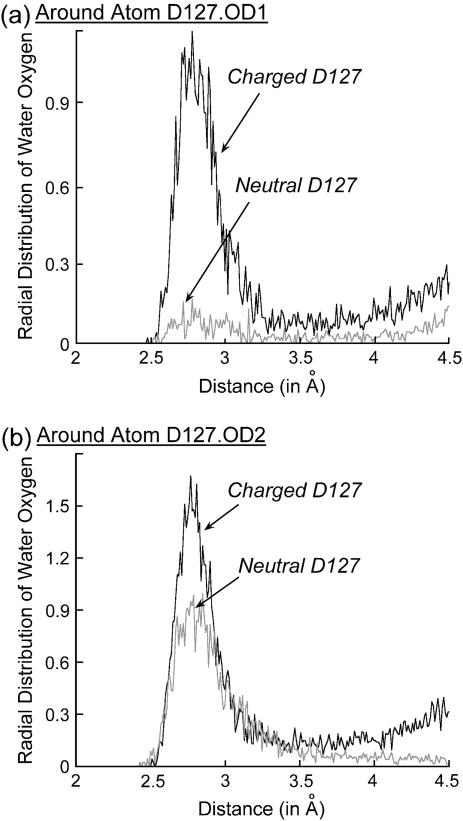
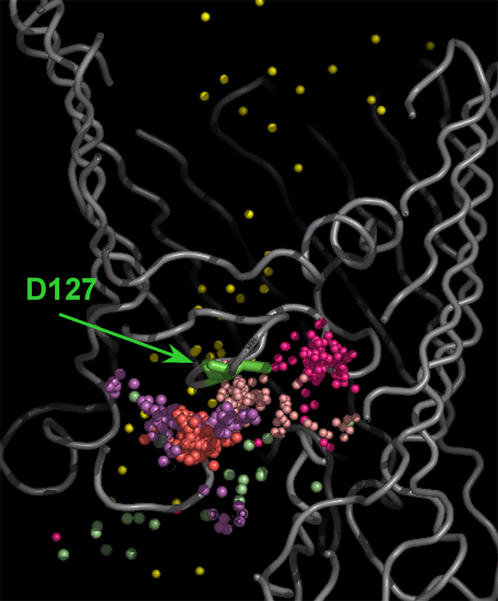
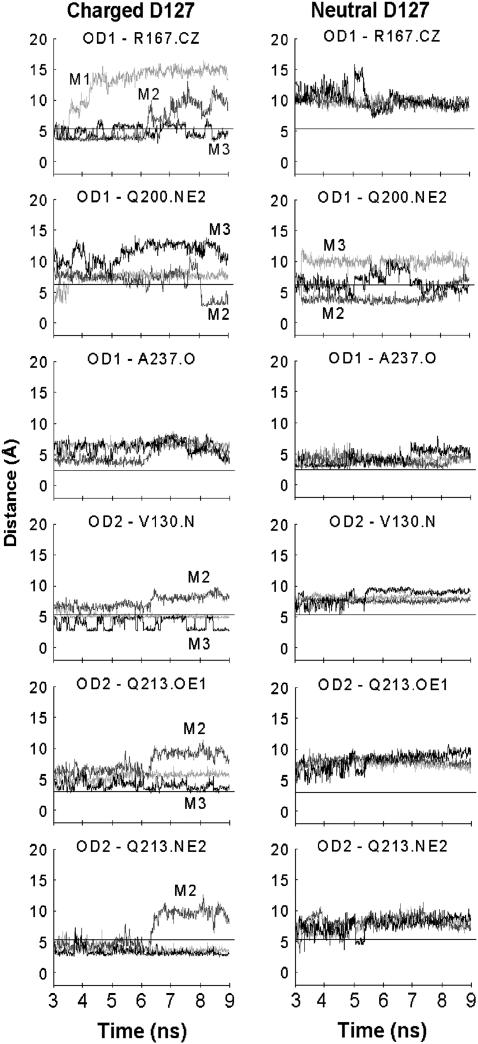
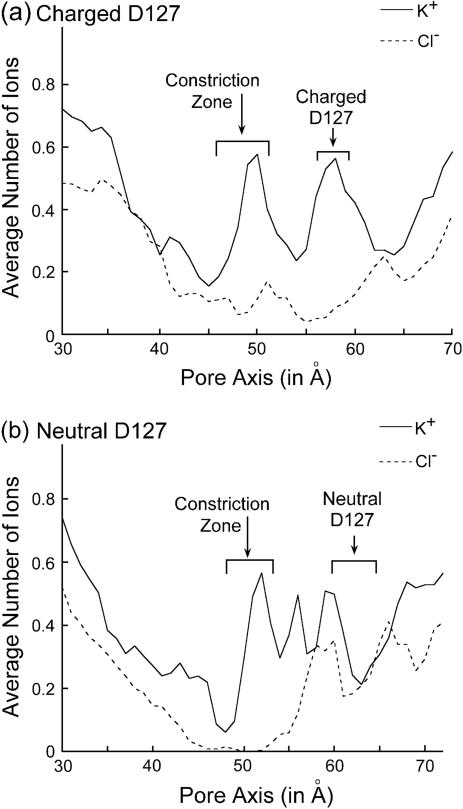
Several groups, including our own, have found molecular dynamics (MD) calculations to result in the size of the pore of an outer membrane bacterial porin, OmpF, to be reduced relative to its size in the x-ray crystal structure. At the narrowest portion of its pore, loop L3 was found to move toward the opposite face of the pore, resulting in decreasing the cross-section area by a factor of approximately 2. In an earlier work, we computed the protonation states of titratable residues for this system and obtained values different from those that had been used in previous MD simulations. Here, we show that MD simulations carried out with these recently computed protonation states accurately reproduce the cross-sectional area profile of the channel lumen in agreement with the x-ray structure. Our calculations include the investigation of the effect of assigning different protonation states to the one residue, D(127), whose protonation state could not be modeled in our earlier calculation. We found that both assumptions of charge states for D(127) reproduced the lumen size profile of the x-ray structure. We also found that the charged state of D(127) had a higher degree of hydration and it induced greater mobility of polar side chains in its vicinity, indicating that the apparent polarizability of the D(127) microenvironment is a function of the D(127) protonation state.
Figures
Similar articles
-
Ions and counterions in a biological channel: a molecular dynamics simulation of OmpF porin from Escherichia coli in an explicit membrane with 1 M KCl aqueous salt solution.J Mol Biol. 2002 Jun 21;319(5):1177-97. doi: 10.1016/S0022-2836(02)00380-7. J Mol Biol. 2002. PMID: 12079356
-
Ionization states of residues in OmpF and mutants: effects of dielectric constant and interactions between residues.Biophys J. 2004 Feb;86(2):690-704. doi: 10.1016/S0006-3495(04)74148-X. Biophys J. 2004. PMID: 14747308 Free PMC article.
-
Role of charged residues at the OmpF porin channel constriction probed by mutagenesis and simulation.Biochemistry. 2001 May 29;40(21):6319-25. doi: 10.1021/bi010046k. Biochemistry. 2001. PMID: 11371193
-
Biomolecular simulations at constant pH.Curr Opin Struct Biol. 2005 Apr;15(2):157-63. doi: 10.1016/j.sbi.2005.02.002. Curr Opin Struct Biol. 2005. PMID: 15837173 Review.
-
Proteins as strongly correlated protonic systems.FEBS Lett. 2012 Mar 9;586(5):519-25. doi: 10.1016/j.febslet.2011.09.036. Epub 2011 Oct 5. FEBS Lett. 2012. PMID: 21985970 Free PMC article. Review.
Cited by
-
Ionic partition and transport in multi-ionic channels: a molecular dynamics simulation study of the OmpF bacterial porin.Biophys J. 2010 Oct 6;99(7):2107-15. doi: 10.1016/j.bpj.2010.07.058. Biophys J. 2010. PMID: 20923644 Free PMC article.
-
Continuum electrostatic calculations of the pKa of ionizable residues in an ion channel: dynamic vs. static input structure.Eur Phys J E Soft Matter. 2010 Apr;31(4):429-39. doi: 10.1140/epje/i2010-10597-y. Epub 2010 Apr 25. Eur Phys J E Soft Matter. 2010. PMID: 20419466
-
Interaction of Tryptophan- and Arginine-Rich Antimicrobial Peptide with E. coli Outer Membrane-A Molecular Simulation Approach.Int J Mol Sci. 2023 Jan 19;24(3):2005. doi: 10.3390/ijms24032005. Int J Mol Sci. 2023. PMID: 36768325 Free PMC article.
-
Advances in Computational and Bioinformatics Tools and Databases for Designing and Developing a Multi-Epitope-Based Peptide Vaccine.Int J Pept Res Ther. 2023;29(4):60. doi: 10.1007/s10989-023-10535-0. Epub 2023 May 23. Int J Pept Res Ther. 2023. PMID: 37251529 Free PMC article. Review.
-
Dynamics and Interactions of OmpF and LPS: Influence on Pore Accessibility and Ion Permeability.Biophys J. 2016 Feb 23;110(4):930-8. doi: 10.1016/j.bpj.2016.01.002. Biophys J. 2016. PMID: 26910429 Free PMC article.
References
-
- Jap, B. K., and P. J. Walian. 1990. Biophysics of the structure and function of porins. Q. Rev. Biophys. 23:367–403. - PubMed
-
- Nikaido, H. 1993. Transport across the bacterial outer membrane. J. Bioenerg. Biomembr. 25:581–589. - PubMed
-
- Schulz, G. E. 1996. Porins: general to specific, native to engineered passive pores. Curr. Opin. Struct. Biol. 6:485–490. - PubMed
-
- Delcour, A. H. 1997. MiniReview: function and modulation of bacterial porins: insights from electrophysiology. FEMS Microbiol. Lett. 151:115–123. - PubMed
Publication types
MeSH terms
Substances
Grants and funding
LinkOut - more resources
Full Text Sources
Molecular Biology Databases
