

Short-term regulation of excitation-contraction coupling by the beta1a subunit in adult mouse skeletal muscle
- PMID: 16183888
- PMCID: PMC1366963
- DOI: 10.1529/biophysj.105.067116
Short-term regulation of excitation-contraction coupling by the beta1a subunit in adult mouse skeletal muscle
Abstract
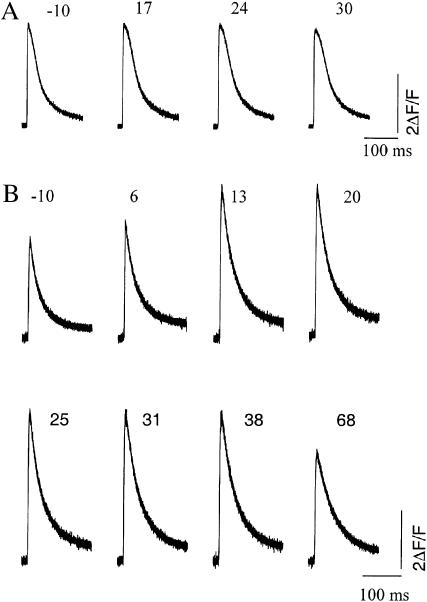
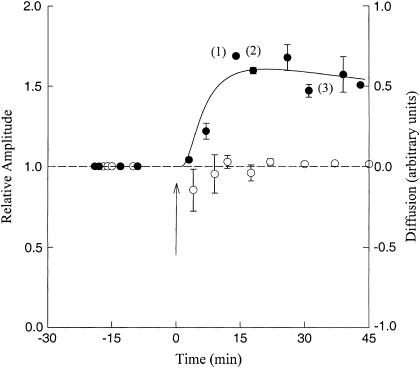
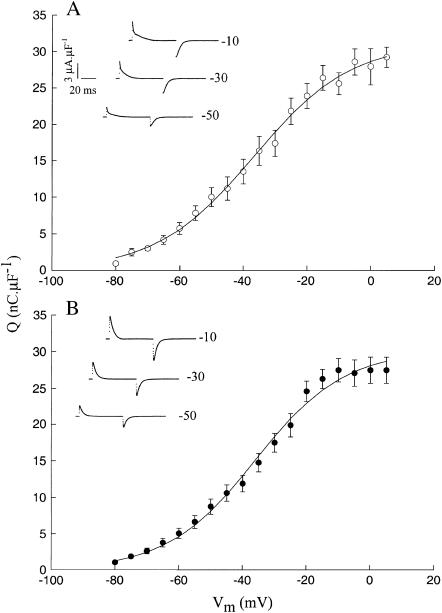
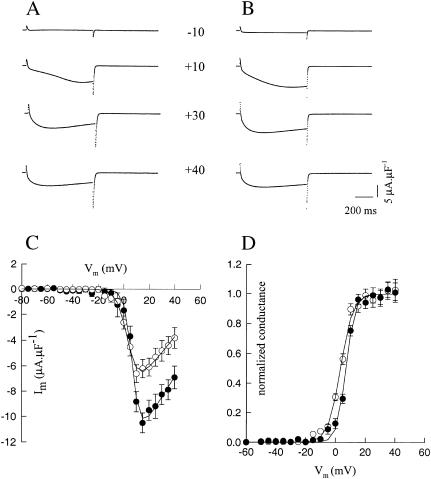
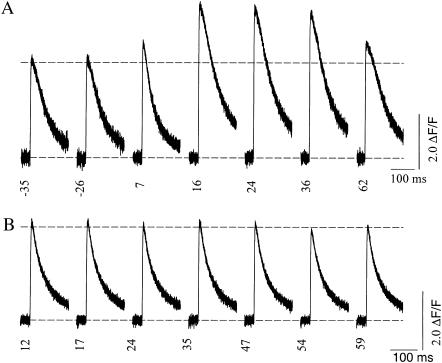
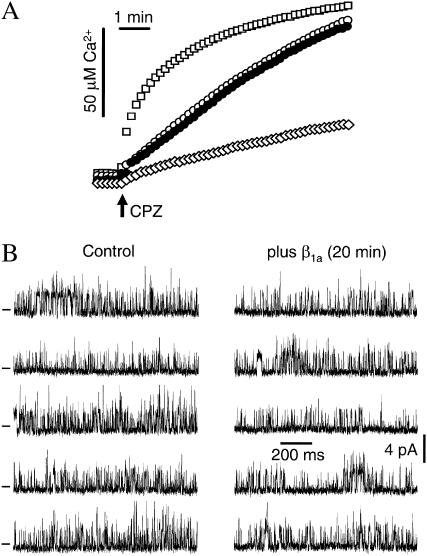
The beta1a subunit of the skeletal muscle voltage-gated Ca2+ channel plays a fundamental role in the targeting of the channel to the tubular system as well as in channel function. To determine whether this cytosolic auxiliary subunit is also a regulatory protein of Ca2+ release from the sarcoplasmic reticulum in vivo, we pressure-injected the beta1a subunit into intact adult mouse muscle fibers and recorded, with Fluo-3 AM, the intracellular Ca2+ signal induced by the action potential. We found that the beta1a subunit significantly increased, within minutes, the amplitude of Ca2+ release without major changes in its time course. beta1a subunits with the carboxy-terminus region deleted did not show an effect on Ca2+ release. The possibility that potentiation of Ca2+ release is due to a direct interaction between the beta1a subunit and the ryanodine receptor was ruled out by bilayer experiments of RyR1 single-channel currents and also by Ca2+ flux experiments. Our data suggest that the beta1a subunit is capable of regulating E-C coupling in the short term and that the integrity of the carboxy-terminus region is essential for its modulatory effect.
Figures
Similar articles
-
Bridging the myoplasmic gap: recent developments in skeletal muscle excitation-contraction coupling.J Muscle Res Cell Motil. 2007;28(4-5):275-83. doi: 10.1007/s10974-007-9118-5. Epub 2007 Sep 26. J Muscle Res Cell Motil. 2007. PMID: 17899404 Review.
-
Involvement of a heptad repeat in the carboxyl terminus of the dihydropyridine receptor beta1a subunit in the mechanism of excitation-contraction coupling in skeletal muscle.Biophys J. 2004 Aug;87(2):929-42. doi: 10.1529/biophysj.104.043810. Biophys J. 2004. PMID: 15298900 Free PMC article.
-
Truncation of the carboxyl terminus of the dihydropyridine receptor beta1a subunit promotes Ca2+ dependent excitation-contraction coupling in skeletal myotubes.Biophys J. 2003 Jan;84(1):220-37. doi: 10.1016/S0006-3495(03)74844-9. Biophys J. 2003. PMID: 12524277 Free PMC article.
-
β1a490-508, a 19-residue peptide from C-terminal tail of Cav1.1 β1a subunit, potentiates voltage-dependent calcium release in adult skeletal muscle fibers.Biophys J. 2014 Feb 4;106(3):535-47. doi: 10.1016/j.bpj.2013.11.4503. Biophys J. 2014. PMID: 24507594 Free PMC article.
-
Functional equivalence of dihydropyridine receptor alpha1S and beta1a subunits in triggering excitation-contraction coupling in skeletal muscle.Biol Res. 2004;37(4):565-75. doi: 10.4067/s0716-97602004000400010. Biol Res. 2004. PMID: 15709683 Review.
Cited by
-
Biological physics in México: Review and new challenges.J Biol Phys. 2011 Mar;37(2):167-84. doi: 10.1007/s10867-011-9218-8. Epub 2011 Feb 11. J Biol Phys. 2011. PMID: 22379227 Free PMC article.
-
Regions of ryanodine receptors that influence activation by the dihydropyridine receptor β1a subunit.Skelet Muscle. 2015 Jul 22;5:23. doi: 10.1186/s13395-015-0049-3. eCollection 2015. Skelet Muscle. 2015. PMID: 26203350 Free PMC article.
-
Bridging the myoplasmic gap: recent developments in skeletal muscle excitation-contraction coupling.J Muscle Res Cell Motil. 2007;28(4-5):275-83. doi: 10.1007/s10974-007-9118-5. Epub 2007 Sep 26. J Muscle Res Cell Motil. 2007. PMID: 17899404 Review.
-
Effects of inserting fluorescent proteins into the alpha1S II-III loop: insights into excitation-contraction coupling.J Gen Physiol. 2009 Jul;134(1):35-51. doi: 10.1085/jgp.200910241. J Gen Physiol. 2009. PMID: 19564426 Free PMC article.
-
Ca2+ Channels Mediate Bidirectional Signaling between Sarcolemma and Sarcoplasmic Reticulum in Muscle Cells.Cells. 2019 Dec 24;9(1):55. doi: 10.3390/cells9010055. Cells. 2019. PMID: 31878335 Free PMC article. Review.
References
-
- Ríos, E., and G. Pizarro. 1991. Voltage sensor of excitation-contraction coupling in skeletal muscle. Physiol. Rev. 71:849–908. - PubMed
-
- Lamb, G. D. 1992. DHP receptors and excitation-contraction coupling. J. Muscle Res. Cell Motil. 13:394–405. - PubMed
-
- Huang, C. L. H. 1993. Intramembrane Charge Movements in Striated Muscle. Clarendon Press, Oxford, UK.
-
- Melzer, W., A. Herrmann-Frank, and H. C. Luttgau. 1995. The role of Ca2+ ions in excitation-contraction coupling of skeletal muscle fibres. Biochim. Biophys. Acta. 1241:59–116. - PubMed
Publication types
MeSH terms
Substances
Grants and funding
LinkOut - more resources
Full Text Sources
Miscellaneous
