

Benign versus malignant breast masses: optical differentiation with US-guided optical imaging reconstruction
- PMID: 16183924
- PMCID: PMC1533766
- DOI: 10.1148/radiol.2371041236
Benign versus malignant breast masses: optical differentiation with US-guided optical imaging reconstruction
Erratum in
- Radiology. 2006 May;239(2):613
Abstract
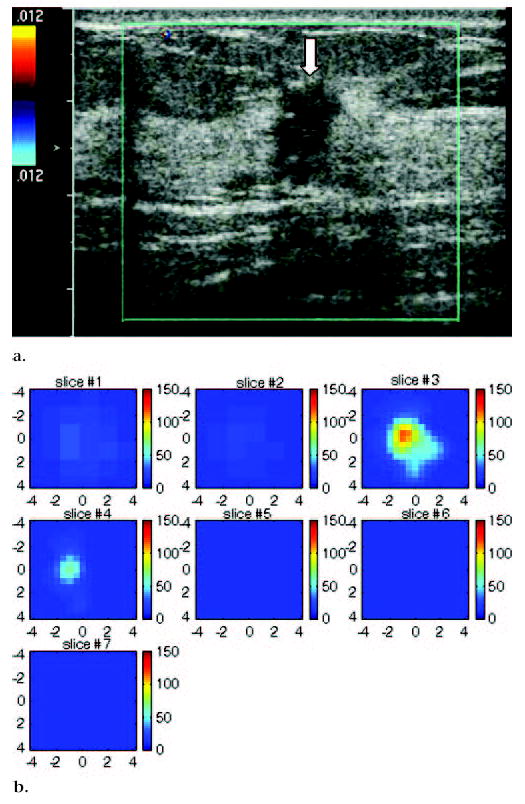
Purpose: To investigate prospectively the feasibility of using optical tomography with ultrasonographic (US) localization to differentiate malignant from benign breast masses and to compare optical tomography with color Doppler US.
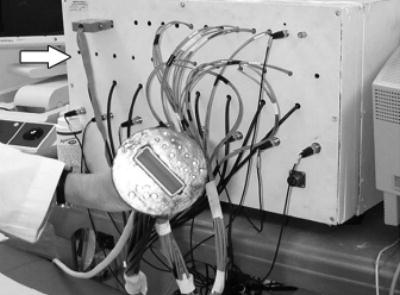
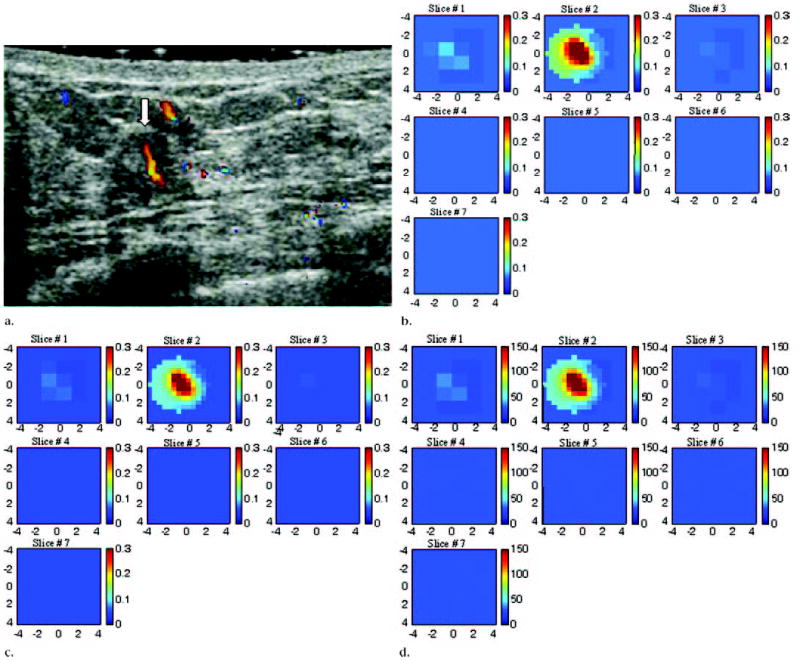
Materials and methods: The study was approved by the local internal review board committee and by the Human Subjects Research Review Board of Army Medical Research and Materiel Command. Signed informed consent was obtained, and the study was HIPAA compliant. Between May 2003 and March 2004, 65 consecutive women (mean age, 51 years; age range, 24-80 years) with 81 breast lesions underwent US-guided biopsy and were scanned with a combined imager. The hand-held probe, which consisted of a centrally located US transducer surrounded by near-infrared sensors, was used to simultaneously acquire coregistered US images and optical data. The lesion location obtained at US was used to guide optical imaging reconstruction. Light absorption was measured at two wavelengths. From these measurements, tumor angiogenesis was assessed on the basis of calculated total hemoglobin concentration. A Student t distribution was used to calculate the statistical significance of mean maximum and mean average hemoglobin concentrations obtained in malignant and benign lesion groups, and P < .001 was considered to indicate a statistically significant difference.
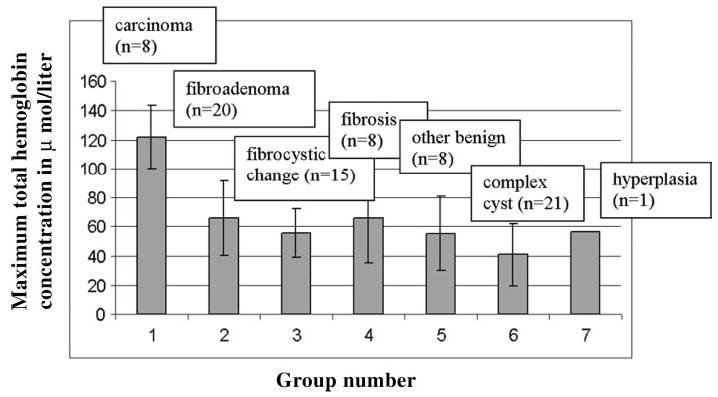
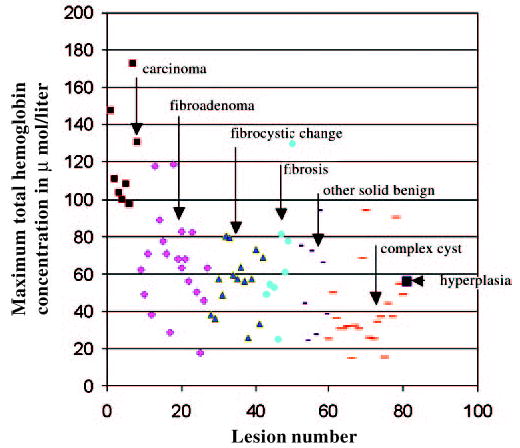
Results: Biopsy results revealed eight early stage invasive carcinomas (malignant group) and 73 benign lesions (benign group). The mean maximum and mean average hemoglobin concentrations in the malignant group were 122 micromol/L +/- 26.8 (+/- standard deviation) and 88 micromol/L +/- 24.5, respectively. The mean maximum and mean average hemoglobin concentrations in the benign group were 55 micromol/L +/- 24.8 and 38 micromol/L +/- 17.4, respectively. Both the maximum and average total hemoglobin concentrations were significantly higher in the malignant group compared with the benign group (P < .001). When a maximum hemoglobin concentration of 95 micromol/L was used as the threshold value, the sensitivity, specificity, positive predictive value, and negative predictive value of optical tomography were 100%, 96%, 73%, and 100%, respectively, and the sensitivity, specificity, positive predictive value, and negative predictive value of color Doppler US were 63%, 69%, 19%, and 94%, respectively.
Conclusion: Findings indicate that optical tomography with US localization is feasible for differentiating benign and early stage malignant breast lesions.
RSNA, 2005
Figures
Comment in
-
Optical differentiation of benign versus malignant breast lesions.Radiology. 2006 Sep;240(3):912-3; author reply 913-4. doi: 10.1148/radiol.2403051630. Radiology. 2006. PMID: 16926337 No abstract available.
Similar articles
-
Early-stage invasive breast cancers: potential role of optical tomography with US localization in assisting diagnosis.Radiology. 2010 Aug;256(2):367-78. doi: 10.1148/radiol.10091237. Epub 2010 Jun 22. Radiology. 2010. PMID: 20571122 Free PMC article.
-
Assessment of Functional Differences in Malignant and Benign Breast Lesions and Improvement of Diagnostic Accuracy by Using US-guided Diffuse Optical Tomography in Conjunction with Conventional US.Radiology. 2016 Aug;280(2):387-97. doi: 10.1148/radiol.2016151097. Epub 2016 Mar 2. Radiology. 2016. PMID: 26937708 Free PMC article.
-
Solid breast lesions: clinical experience with US-guided diffuse optical tomography combined with conventional US.Radiology. 2012 Nov;265(2):371-8. doi: 10.1148/radiol.12120086. Epub 2012 Sep 25. Radiology. 2012. PMID: 23012460
-
Optical tomography with ultrasound localization for breast cancer diagnosis and treatment monitoring.Surg Oncol Clin N Am. 2007 Apr;16(2):307-21. doi: 10.1016/j.soc.2007.03.008. Surg Oncol Clin N Am. 2007. PMID: 17560514 Free PMC article. Review.
-
Optical tomography of breast cancer-monitoring response to primary medical therapy.Target Oncol. 2009 Sep;4(3):219-33. doi: 10.1007/s11523-009-0115-z. Epub 2009 Sep 24. Target Oncol. 2009. PMID: 19777322 Review.
Cited by
-
Near-Infrared Visual Differentiation in Normal and Abnormal Breast Using Hemoglobin Concentrations.J Lasers Med Sci. 2018 Winter;9(1):50-57. doi: 10.15171/jlms.2018.11. Epub 2017 Dec 26. J Lasers Med Sci. 2018. PMID: 29399312 Free PMC article.
-
Microscopic lymph node tumor burden quantified by macroscopic dual-tracer molecular imaging.Nat Med. 2014 Nov;20(11):1348-53. doi: 10.1038/nm.3732. Epub 2014 Oct 26. Nat Med. 2014. PMID: 25344739 Free PMC article.
-
Modeling time resolved light propagation inside a realistic human head model.J Biomed Phys Eng. 2014 Jun 8;4(2):49-60. eCollection 2014 Jun. J Biomed Phys Eng. 2014. PMID: 25505770 Free PMC article.
-
Predicting Treatment Response of Breast Cancer to Neoadjuvant Chemotherapy Using Ultrasound-Guided Diffuse Optical Tomography.Transl Oncol. 2018 Feb;11(1):56-64. doi: 10.1016/j.tranon.2017.10.011. Epub 2017 Nov 22. Transl Oncol. 2018. PMID: 29175630 Free PMC article.
-
Noncontact diffuse correlation tomography of human breast tumor.J Biomed Opt. 2015 Aug;20(8):86003. doi: 10.1117/1.JBO.20.8.086003. J Biomed Opt. 2015. PMID: 26259706 Free PMC article.
References
-
- Poplack SP, Tosteson AN, Grove MR, Wells WA, Carney PA. Mammography in 53,803 women from the New Hampshire Mammography Network. Radiology. 2000;217:832–840. - PubMed
-
- Hilton SV, Leopold GR, Olson LK, Willson SA. Real-time breast sonography: application in 300 consecutive patients. AJR Am J Roentgenol. 1986;147:479–486. - PubMed
-
- Rubin E, Miller VE, Berland LL, Han SY, Koehler RE, Stanley RJ. Hand-held real-time breast sonography. AJR Am J Roentgenol. 1985;144:623–627. - PubMed
-
- Jackson VP. The current role of ultrasonography in breast imaging. Radiol Clin North Am. 1995;33:1161–1170. - PubMed
-
- Venta LA, Dudiak CM, Salomon CG, Flisak ME. Sonographic evaluation of the breast. RadioGraphics. 1994;14:29–50. - PubMed
MeSH terms
Substances
Grants and funding
LinkOut - more resources
Full Text Sources
Other Literature Sources
Medical
