. 2005 Sep;1(4):e41.
doi: 10.1371/journal.pcbi.0010041. Epub 2005 Sep 23.

A digital atlas to characterize the mouse brain transcriptome

Affiliations

A digital atlas to characterize the mouse brain transcriptome

James P Carson et al. PLoS Comput Biol. 2005 Sep.

Abstract

Massive amounts of data are being generated in an effort to represent for the brain the expression of all genes at cellular resolution. Critical to exploiting this effort is the ability to place these data into a common frame of reference. Here we have developed a computational method for annotating gene expression patterns in the context of a digital atlas to facilitate custom user queries and comparisons of this type of data. This procedure has been applied to 200 genes in the postnatal mouse brain. As an illustration of utility, we identify candidate genes that may be related to Parkinson disease by using the expression of a dopamine transporter in the substantia nigra as a search query pattern. In addition, we discover that transcription factor Rorb is down-regulated in the barrelless mutant relative to control mice by quantitative comparison of expression patterns in layer IV somatosensory cortex. The semi-automated annotation method developed here is applicable to a broad spectrum of complex tissues and data modalities.


Conflict of interest statement

Competing interests. The authors have declared that no competing interests exist.

Figures

Figure 1
Figure 1. P7 Mouse Brain Atlas Construction and Application
(A) Standard Nissl-stained P7 sagittal standard section number 4 with major anatomical boundaries drawn in red: amygdala (am), basal forebrain (bf), cerebellum (cb), cortex (ctx), globus pallidus (gp), hippocampus (hi), medulla (med), midbrain (mb), olfactory bulb (ob), pons (p), striatum (st), thalamus (th), and ventral striatum (vst). (B) The coarse mesh, shown here for the thalamus, is constructed by defining vertices of quadrilaterals. (C) Iterative application of subdivision generates smooth boundary curves and a smooth internal representation of smaller quadrilaterals. Fixed vertices (large squares) allow crease angles to be added to the otherwise smooth boundary curve. (D) The atlas for standard section number 4. Each coarse quadrilateral is associated with a particular anatomical structure, an association inherited during subdivision. (E) Expression pattern of Cannabinoid receptor 1 in a section similar to standard map 4. (F) The atlas (D) is deformed by moving vertices so that the anatomical boundaries match those in the Cannabinoid receptor 1 section (E). (G) Quadrilaterals overlying the DG (insert) were marked in 59 fitted maps using a mesh generated after two rounds of subdivision. In every section, the same four quadrilaterals were found to overlap the bulk of the DG.
Figure 2
Figure 2. Examples of Gene Expression Patterns
Shown are gene expression patterns revealed by nonradioactive robotic ISH on sagittal sections. Digoxigenin-tagged RNA probes hybridized to cellular mRNA are visualized via a serial amplification that produces a blue-purple signal. (A) Purkinje cell protein 4 in section 4. (B) Ly6/neurotoxin 1 in section 6. (C) 4931408A02Rik in section 9 with inset showing localized expression in midbrain neurons. (D) A230109K2Rik in section 9 with inset showing localized expression in hypothalamus. (E) RAS protein-specific guanine nucleotide-releasing factor 1 in section 11. (F) Gastrin releasing peptide in section 2. (G) Nephroblastoma overexpressed gene in section 4. (H) Somatostatin in section 6.
Figure 3
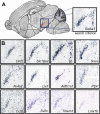
Figure 3. A Search for Genes that Are Expressed in the Substantia Nigra
(A) The pattern of Slc6a3 gene expression in and around the substantia nigra at standard section number 6 is set as the query pattern for a search of all 200 expression patterns in the current dataset. Note the color-coded shading of the query pattern, with red indicating the strong expression of Slc6a3 in the substantia nigra, and grey indicating no expression in the tissue surrounding the substantia nigra. (B) The expression patterns in the substantia nigra pars compacta of the 12 genes found to match the search criterion best are shown: dopamine receptor 2 (Drd2); vesicular monoamine transporter 2 (Slc18a2); tyrosine hydroxylase (Th); alpha synuclein (Snca); a gene encoding a nuclear orphan receptor (Nr4a2); limb expression 1 homolog (Lix1); a gene encoding an aldehyde dehydrogenase (Aldh1a1); protein tyrosine phosphatase, receptor type L (Ptprl); chaperonin subunit 8 (Cct8); synaptic vesicle glycoprotein 2c (Sv2c); transmembrane protein 1 (Tmem1); and LIM homeobox transcription factor 1 beta (Lmx1b).
Figure 4
Figure 4. Quantitative Analysis of Rorb and Grm2 Expression in Control and brl P7 Brains
(A) The dataset of 200 genes was searched using a query pattern defined as strong expression in layer IV of the somatosensory cortex (SsCx) (red) and no expression in layers I and II/III somatosensory cortex (grey) for standard section 2. Rorb and Grm2 were two of the top matches returned. (B) The strong expression Rorb in control somatosensory cortex layer IV coincides with the anatomical shape of the barrels that are absent in the brl mouse. For both genotypes, cellular expression was detected and color-coded by signal strength using the Celldetekt software, followed by fitting of the appropriate subdivision mesh to the shape of the cortex. A row of 12 quadrilaterals in the subdivision mesh defines the area of comparison in the somatosensory cortex layer IV. Note the greater prevalence of strongly expressing cells (red) in the control tissue. Moderately expressing cells and weakly expressing cells are indicated by blue and yellow, respectively. (C) Quantification of Grm2 expression in somatosensory cortex layer IV as described for Rorb showed no difference in expression strength distribution between control and brl. (D) Statistical comparisons between control and brl revealed no significant changes in the percentage of somatosensory cortex layer IV cells expressing either Rorb (p = 0.8) or Grm2 (p = 0.5). However, a significant decrease in the percentage of strongly expressing cells was found for Rorb in brl (p = 0.02), but not for Grm2 (p = 0.8). (E) The somatosensory cortex containing the barrel region was dissected as indicated (highlighted and boxed) and used for quantitative real-time PCR analysis. (F) Consistent with the ISH data, a statistically significant decrease in Rorb expression was found in brl by quantitative real-time PCR (p = 0.008).

References

    1. Neidhardt L, Gasca S, Wertz K, Obermayr F, Worpenberg S, et al. Large-scale screen for genes controlling mammalian embryogenesis, using high-throughput gene expression analysis in mouse embryos. Mech Dev. 2000;98:77–94. - PubMed
    1. Visel A, Thaller C, Eichele G. GenePaint.org: An atlas of gene expression patterns in the mouse embryo. Nucleic Acids Res. 2004;32:D552–D556. - PMC - PubMed
    1. Boguski MS, Jones AR. Neurogenomics: At the intersection of neurobiology and genome sciences. Nat Neurosci. 2004;7:429–433. - PubMed
    1. Gray PA, Fu H, Luo P, Zhao Q, Yu J, et al. Mouse brain organization revealed through direct genome-scale TF expression analysis. Science. 2004;306:2255–2257. - PubMed
    1. Gong S, Zheng C, Doughty ML, Losos K, Didkovsky N, et al. A gene expression atlas of the central nervous system based on bacterial artificial chromosomes. Nature. 2003;425:917–925. - PubMed

Publication types