

The subiculum: what it does, what it might do, and what neuroanatomy has yet to tell us
- PMID: 16185252
- PMCID: PMC1571536
- DOI: 10.1111/j.1469-7580.2005.00446.x
The subiculum: what it does, what it might do, and what neuroanatomy has yet to tell us
Abstract
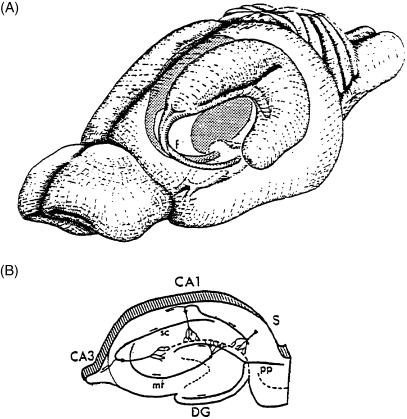
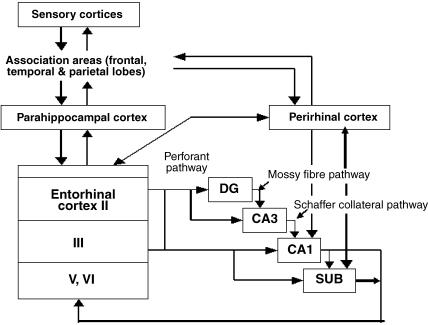
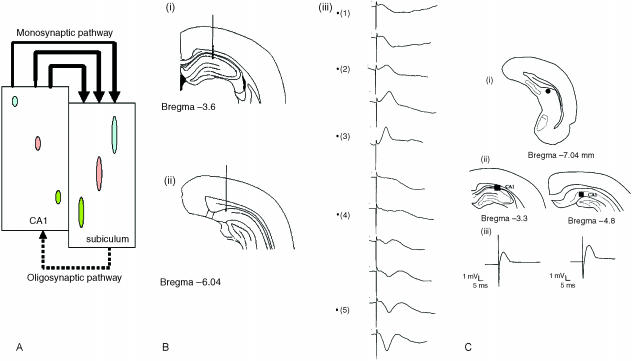
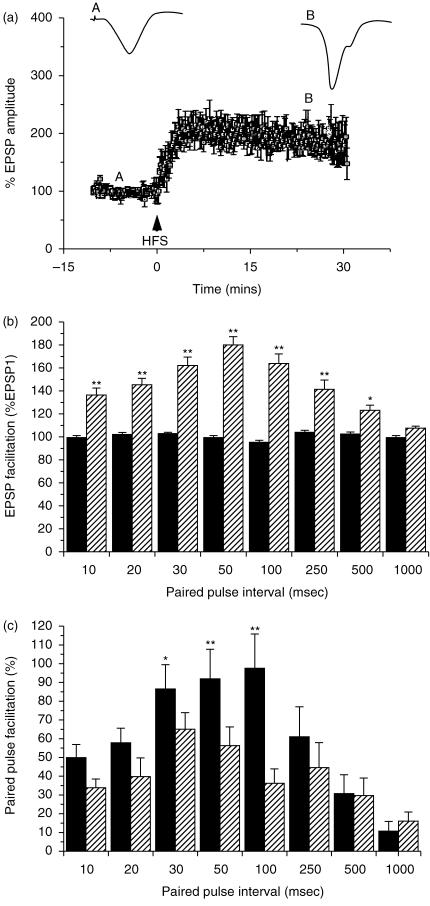
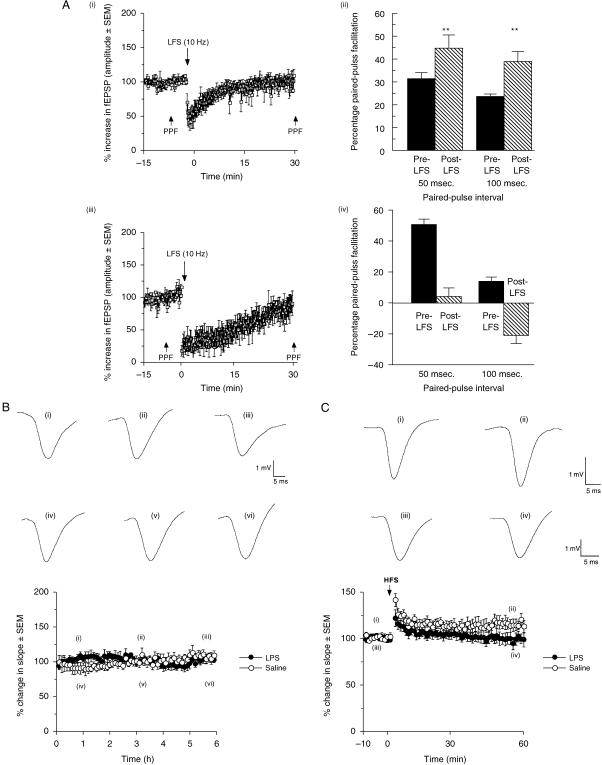
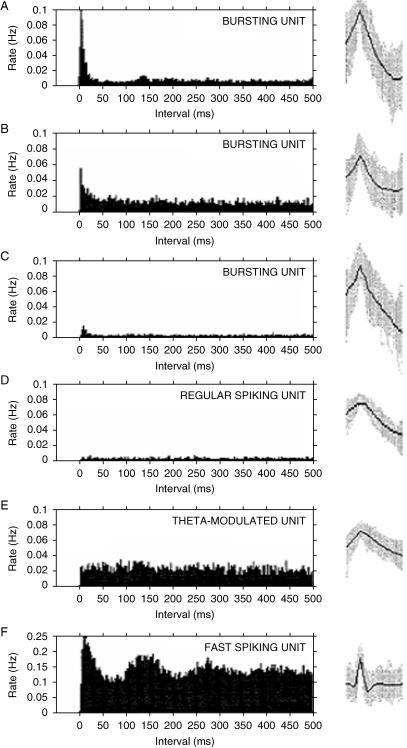
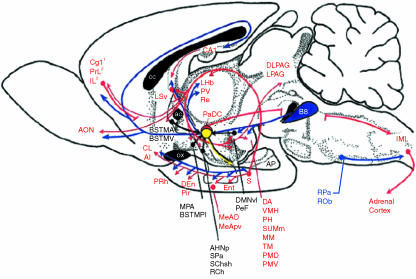
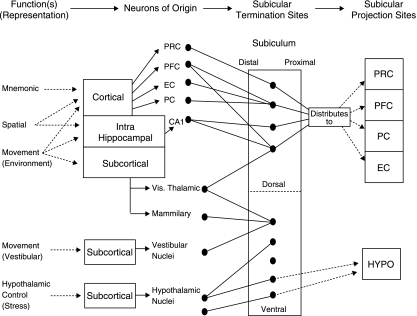
The subiculum is a pivotal but under-investigated structure positioned between the hippocampus proper and entorhinal and other cortices, as well as a range of subcortical structures. The subiculum has a range of electrophysiological and functional properties which are quite distinct from its input areas; given the widespread set of cortical and subcortical areas with which it interacts, it is able to influence activity in quite disparate brain regions. The rules governing plasticity of synaptic transmission in the hippocampal-subicular axis are poorly understood; this axis appears to share some properties in common with the hippocampus proper, but behaves quite differently in other respects. Equally, its functional properties are not well understood; it plays an important but ill-defined role in spatial navigation, mnemonic processing and control of the response to stress. Here, I review investigations of synaptic plasticity in the hippocampal-subicular pathway, recordings of subicular neurons in the freely moving behaving animal, the effects of behavioural and other stressors on subicular synaptic plasticity, and anatomical data on the dorso-ventral organization of the subiculum in relation to the hypothalamic-pituitary-adrenal (HPA) axis. I argue that there is a dorso-ventral segregation of function within the subiculum: the dorsal component appears principally concerned with the processing of information about space, movement and memory, whereas the ventral component appears to play a major regulatory role in the inhibition of the HPA axis.
Figures
Similar articles
-
The subiculum: a review of form, physiology and function.Prog Neurobiol. 2001 Jun;64(2):129-55. doi: 10.1016/s0301-0082(00)00054-x. Prog Neurobiol. 2001. PMID: 11240210 Review.
-
Controlling hippocampal output: the central role of subiculum in hippocampal information processing.Behav Brain Res. 2006 Nov 11;174(2):304-12. doi: 10.1016/j.bbr.2006.08.018. Epub 2006 Oct 10. Behav Brain Res. 2006. PMID: 17034873 Review.
-
Synaptic plasticity in the hippocampal area CA1-subiculum projection: implications for theories of memory.Hippocampus. 2000;10(4):447-56. doi: 10.1002/1098-1063(2000)10:4<447::AID-HIPO11>3.0.CO;2-2. Hippocampus. 2000. PMID: 10985284 Review.
-
Roles for the subiculum in spatial information processing, memory, motivation and the temporal control of behaviour.Prog Neuropsychopharmacol Biol Psychiatry. 2009 Aug 1;33(5):782-90. doi: 10.1016/j.pnpbp.2009.03.040. Epub 2009 Apr 22. Prog Neuropsychopharmacol Biol Psychiatry. 2009. PMID: 19393282 Review.
-
Functional structure of the intermediate and ventral hippocampo-prefrontal pathway in the prefrontal convergent system.J Physiol Paris. 2013 Dec;107(6):441-7. doi: 10.1016/j.jphysparis.2013.05.002. Epub 2013 May 26. J Physiol Paris. 2013. PMID: 23719128 Review.
Cited by
-
Primate hippocampus size and organization are predicted by sociality but not diet.Proc Biol Sci. 2019 Nov 6;286(1914):20191712. doi: 10.1098/rspb.2019.1712. Epub 2019 Oct 30. Proc Biol Sci. 2019. PMID: 31662078 Free PMC article.
-
Fibrin deposited in the Alzheimer's disease brain promotes neuronal degeneration.Neurobiol Aging. 2015 Feb;36(2):608-17. doi: 10.1016/j.neurobiolaging.2014.10.030. Epub 2014 Oct 31. Neurobiol Aging. 2015. PMID: 25475538 Free PMC article.
-
Noise induced hearing loss impairs spatial learning/memory and hippocampal neurogenesis in mice.Sci Rep. 2016 Feb 4;6:20374. doi: 10.1038/srep20374. Sci Rep. 2016. PMID: 26842803 Free PMC article.
-
Walking and Hippocampal Formation Volume Changes: A Systematic Review.Brain Sci. 2025 Jan 8;15(1):52. doi: 10.3390/brainsci15010052. Brain Sci. 2025. PMID: 39851420 Free PMC article. Review.
-
Acute stress, but not corticosterone, disrupts short- and long-term synaptic plasticity in rat dorsal subiculum via glucocorticoid receptor activation.Cereb Cortex. 2013 Nov;23(11):2611-9. doi: 10.1093/cercor/bhs247. Epub 2012 Aug 23. Cereb Cortex. 2013. PMID: 22918985 Free PMC article.
References
-
- Aggleton JP, Hunt PR, Nagle S, Neave N. The effects of selective lesions within the anterior thalamic nuclei on spatial memory in the rat. Behav Brain Res. 1996;81:189–198. - PubMed
-
- Amaral DG, Dolorfo C, Alvarez-Royo P. Organization of CA1 projections to the subiculum: a PHA-L analysis in the rat. Hippocampus. 1991;1:415–435. - PubMed
-
- Amaral DG, Witter MP. Hippocampal formation. In: Paxinos G, editor. The Rat Nervous System. 2nd. New York: Academic Press; 1995. pp. 247–291.
-
- Anderson M, Commins S, O'Mara SM. The effects of low frequency and two-pulse stimulation protocols on synaptic transmission in the CA1-subiculum pathway in the anaesthetized rat. Neurosci Lett. 2000;279:181–184. - PubMed
-
- Anderson MI, O'Mara SM. Analysis of recordings of single-unit firing and population activity in the dorsal subiculum of unrestrained, freely moving rats. J Neurophysiol. 2003;90:655–665. - PubMed
Publication types
MeSH terms
Grants and funding
LinkOut - more resources
Full Text Sources
