. 2005 Sep 26;170(7):1039-46.
doi: 10.1083/jcb.200504097.

Aurora A activates D-TACC-Msps complexes exclusively at centrosomes to stabilize centrosomal microtubules

Affiliations

Aurora A activates D-TACC-Msps complexes exclusively at centrosomes to stabilize centrosomal microtubules

Teresa P Barros et al. J Cell Biol. .

Abstract

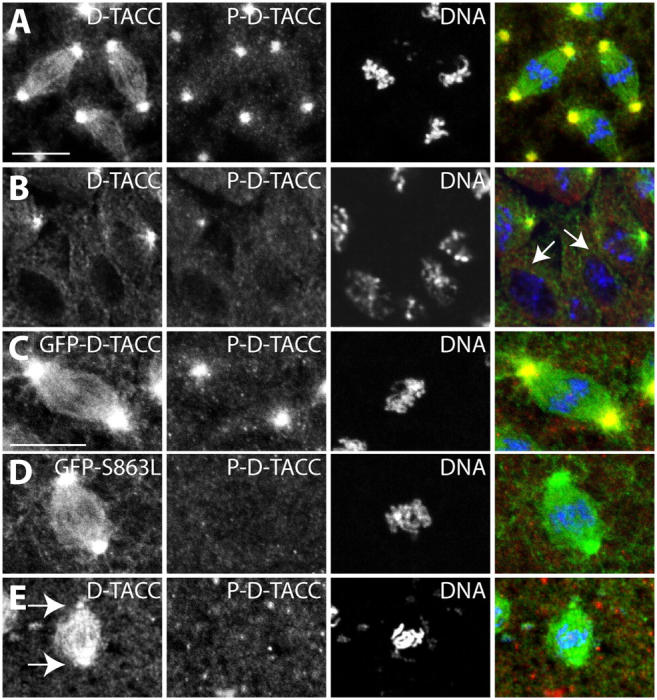
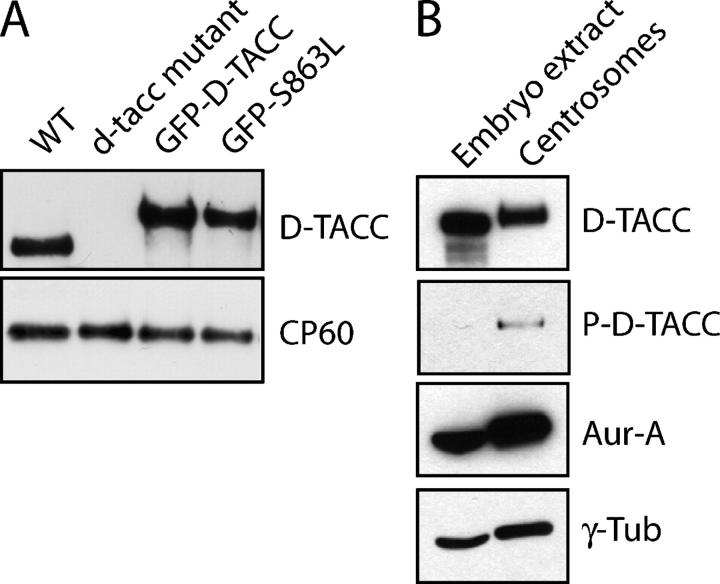
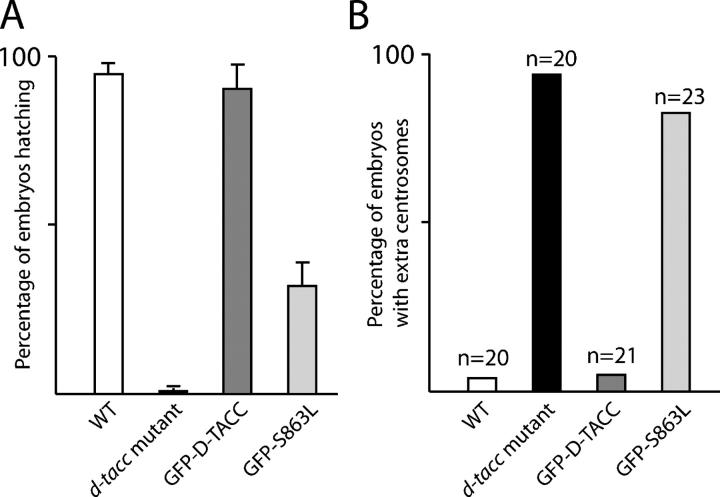
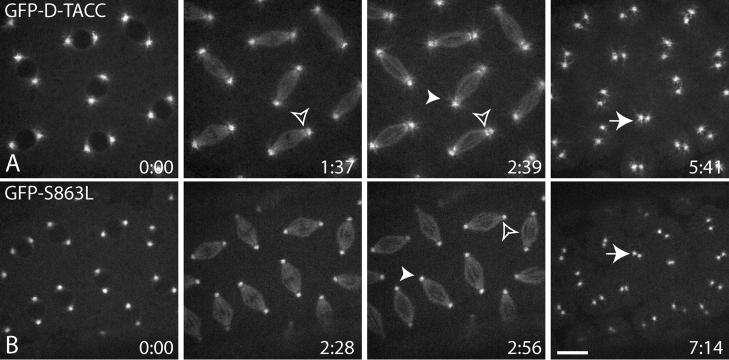
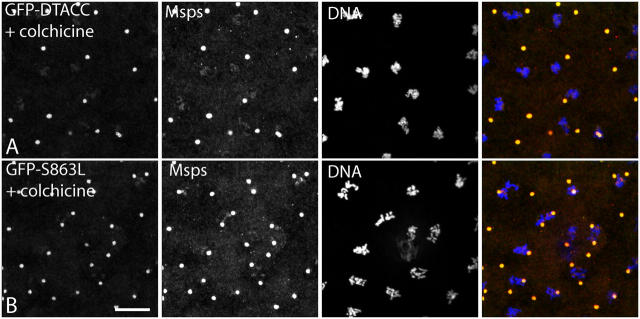
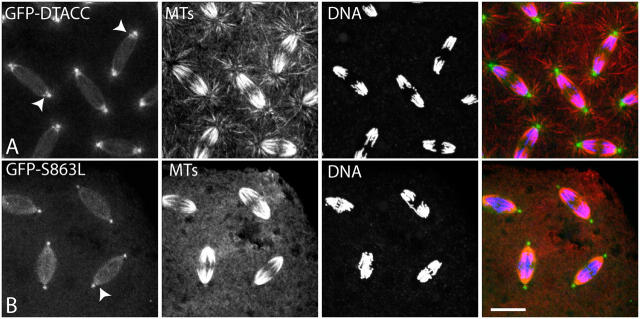
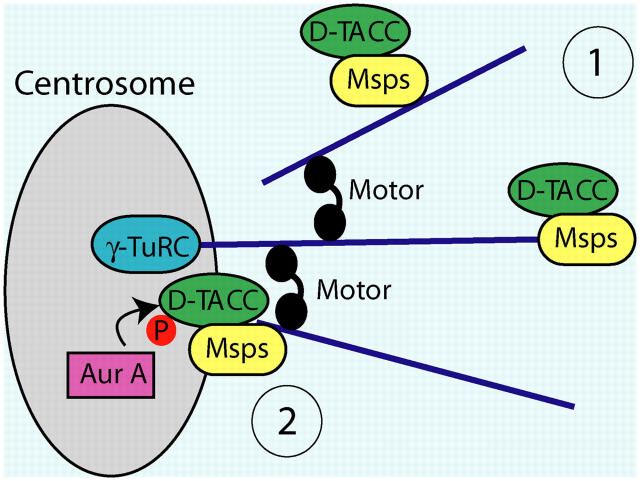
Centrosomes are the dominant sites of microtubule (MT) assembly during mitosis in animal cells, but it is unclear how this is achieved. Transforming acidic coiled coil (TACC) proteins stabilize MTs during mitosis by recruiting Minispindles (Msps)/XMAP215 proteins to centrosomes. TACC proteins can be phosphorylated in vitro by Aurora A kinases, but the significance of this remains unclear. We show that Drosophila melanogaster TACC (D-TACC) is phosphorylated on Ser863 exclusively at centrosomes during mitosis in an Aurora A-dependent manner. In embryos expressing only a mutant form of D-TACC that cannot be phosphorylated on Ser863 (GFP-S863L), spindle MTs are partially destabilized, whereas astral MTs are dramatically destabilized. GFP-S863L is concentrated at centrosomes and recruits Msps there but cannot associate with the minus ends of MTs. We propose that the centrosomal phosphorylation of D-TACC on Ser863 allows D-TACC-Msps complexes to stabilize the minus ends of centrosome-associated MTs. This may explain why centrosomes are such dominant sites of MT assembly during mitosis.


Figures

Figure 1.
Figure 1.
P–D-TACC is concentrated at centrosomes during mitosis. (A and B) The distribution of D-TACC, P–D-TACC, and DNA (green, red, and blue in merged image, respectively) in a wild-type syncytial embryo (A) and a wild-type cellularized embryo (B). D-TACC and P–D-TACC are not detectable at centrosomes in interphase cells in cellularized embryos (interphase cells are indicated by arrows). Note that only a single centrosome from each mitotic cell is present in the focal planes shown. (C) The distribution of GFP–D-TACC, P–D-TACC, and DNA in a d-tacc mutant embryo that has no endogenous D-TACC. GFP–D-TACC is concentrated at centrosomes and spindles, whereas P–D-TACC is concentrated at centrosomes. (D) The distribution of GFP-S863L, P–D-TACC, and DNA in a d-tacc mutant embryo. P–D-TACC is no longer detectable at centrosomes. (E) The distribution of D-TACC, P–D-TACC, and DNA in aur 1 mutant embryos. D-TACC is weakly detectable at centrosomes but P–D-TACC is not. Bar, 10 μm.
Figure 2.
Figure 2.
Western blot analysis of GFP–D-TACC and GFP-S863L expression and of the association of P–D-TACC with centrosomes. (A) A Western blot probed with anti–D-TACC antibodies. First lane, wild-type (WT) embryos; second lane, d-tacc mutant embryos; third lane, d-tacc mutant embryos expressing GFP–D-TACC; fourth lane, d-tacc mutant embryos expressing GFP-S863L. The same blot was reprobed with antibodies against the centrosomal protein CP60 as a loading control. (B) Western blots of whole embryo extracts (first lane) and purified centrosomes (second lane) probed with anti–D-TACC, -P–D-TACC, –Aurora A, and –γ-tubulin antibodies.
Figure 3.
Figure 3.
Quantitation of viability and mitotic defects in GFP–D-TACC and GFP-S863L embryos. (A) A bar chart showing the percentage of embryos that hatch from the following genotypes: wild-type (WT), d-tacc mutant, d-tacc mutant expressing GFP–D-TACC, and d-tacc mutant expressing GFP-S863L. Error bars represent SD. (B) A bar chart showing the percentage of embryos with extra centrosomes at nuclear cycle 14 (indicative of mitotic errors during earlier rounds of nuclear division; Raff, 2003). Numbers at the top of each bar are the number of embryos that were counted.
Figure 4.
Figure 4.
Analysis of living GFP–D-TACC and GFP-S863L embryos. Selected images from videos of living GFP–D-TACC (A) and GFP-S863L (B) embryos (see Videos 1 and 2, respectively, available at http://www.jcb.org/cgi/content/full/jcb.200504097/DC1). Time (minutes/seconds) is shown at the bottom right of each image. Images show the embryos just before entry into mitosis, in metaphase, early anaphase, and early interphase of the following nuclear cycle. Arrows indicate the position of centrosomal flares; closed arrowheads indicate the long arrays of astral MTs in anaphase; open arrowheads indicate the concentration of the GFP fusion protein on the minus ends of spindle MTs. These features are readily detectable in GFP–D-TACC embryos but not in GFP-S863L embryos (see text for details). Bar, 10 μm.
Figure 5.
Figure 5.
The distribution of Msps and GFP–D-TACC or GFP-S863L in embryos treated with colchicine. (A) A GFP–D-TACC (green in merged image) embryo treated with colchicine to depolymerize MTs. The distribution of Msps (red in merged image) and DNA (blue in merged image) are also shown. (B) A GFP-S863L embryo treated with colchicine, labeled as in A. Bar, 10 μm.
Figure 6.
Figure 6.
The distribution of MTs in GFP–D-TACC and GFP-S863L embryos. The distribution of MTs (red in merged images) and GFP–D-TACC or GFP-S863L (green in merged images) is shown in GFP–D-TACC (A) and GFP-S863L (B) embryos during anaphase. Arrowheads indicate the position of GFP–D-TACC binding to the minus ends of spindle MTs. This is not detectable in GFP-S863L embryos. DNA is shown in blue in the merged images. Bar, 10 μm.
Figure 7.
Figure 7.
A schematic model of how the D-TACC–Msps complex stabilizes MTs in D. melanogaster embryos. MTs are nucleated at centrosomes by the γ-tubulin ring complex (γ-TuRC). These MTs are often released from γ-TuRC but are held in the vicinity of the centrosome by the action of MT motors. The bulk of D-TACC–Msps complexes (that are present at centrosomes, along MTs, and throughout the cytoplasm) can bind these MTs either laterally or at plus ends and stabilize them (mechanism 1). Aurora A can specifically activate a small fraction of D-TACC–Msps complexes that are at the centrosome. This allows the phosphorylated complexes (P, red) to interact with and stabilize MT minus ends (mechanism 2). Importantly, this mechanism is only active at centrosomes, and any MTs that form in the cytoplasm will not be stabilized in this way. This may explain, at least in part, why centrosomes are such dominant sites of MT assembly in mitosis.

References

    1. Bellanger, J.M., and P. Gonczy. 2003. TAC-1 and ZYG-9 form a complex that promotes microtubule assembly in C. elegans embryos. Curr. Biol. 13:1488–1498. - PubMed
    1. Berdnik, D., and J.A. Knoblich. 2002. Drosophila Aurora-A is required for centrosome maturation and actin-dependent asymmetric protein localization during mitosis. Curr. Biol. 12:640–647. - PubMed
    1. Cassimeris, L. 1999. Accessory protein regulation of microtubule dynamics throughout the cell cycle. Curr. Opin. Cell Biol. 11:134–141. - PubMed
    1. de Saint Phalle, B., and W. Sullivan. 1998. Spindle assembly and mitosis without centrosomes in parthenogenetic Sciara embryos. J. Cell Biol. 141:1383–1391. - PMC - PubMed
    1. Gergely, F., C. Karlsson, I. Still, J. Cowell, J. Kilmartin, and J.W. Raff. 2000. a. The TACC domain identifies a family of centrosomal proteins that can interact with microtubules. Proc. Natl. Acad. Sci. USA. 97:14352–14357. - PMC - PubMed

Publication types

MeSH terms