. 2005 Sep 26;170(7):1101-11.
doi: 10.1083/jcb.200504035.

Lithium induces autophagy by inhibiting inositol monophosphatase

Affiliations

Lithium induces autophagy by inhibiting inositol monophosphatase

Sovan Sarkar et al. J Cell Biol. .

Abstract

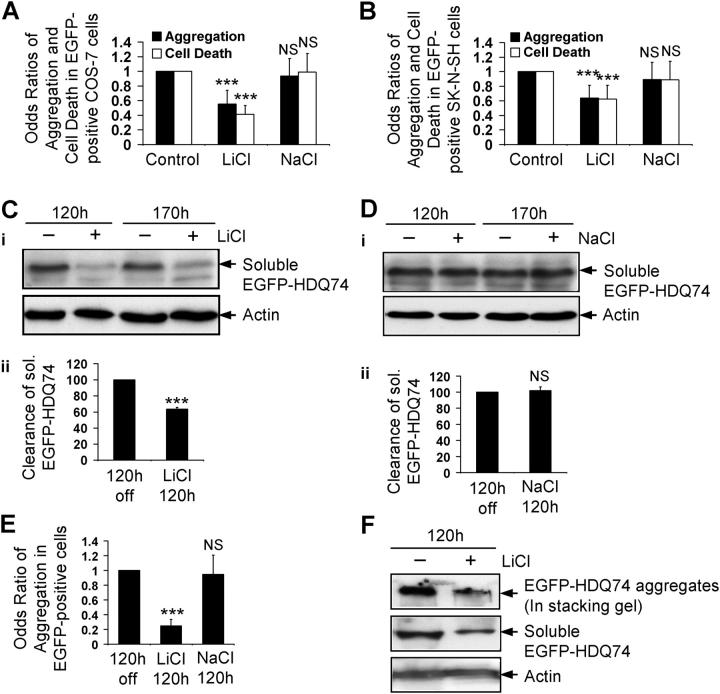
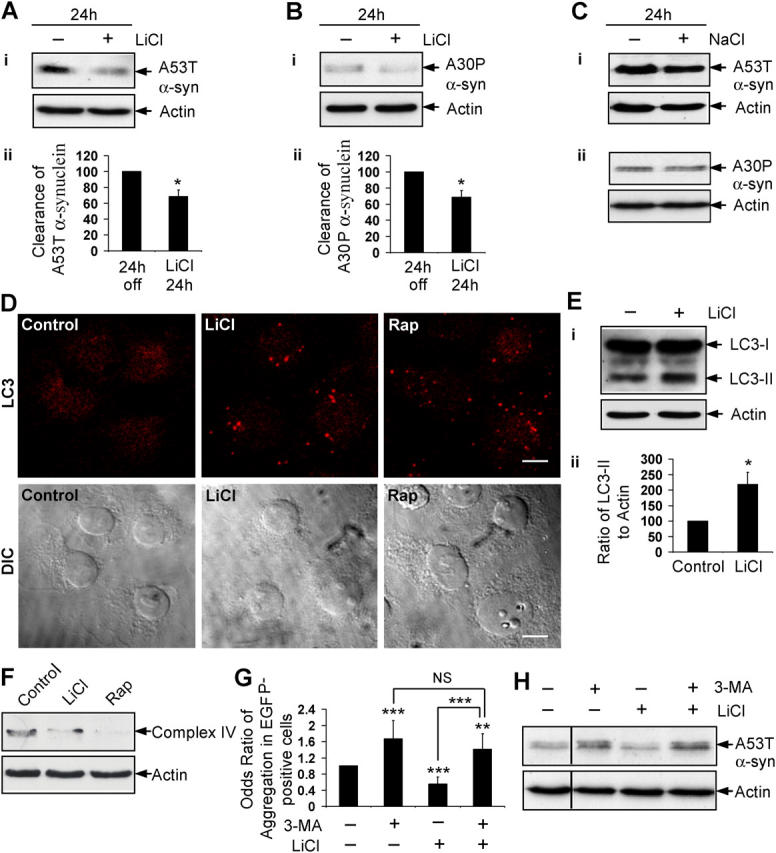
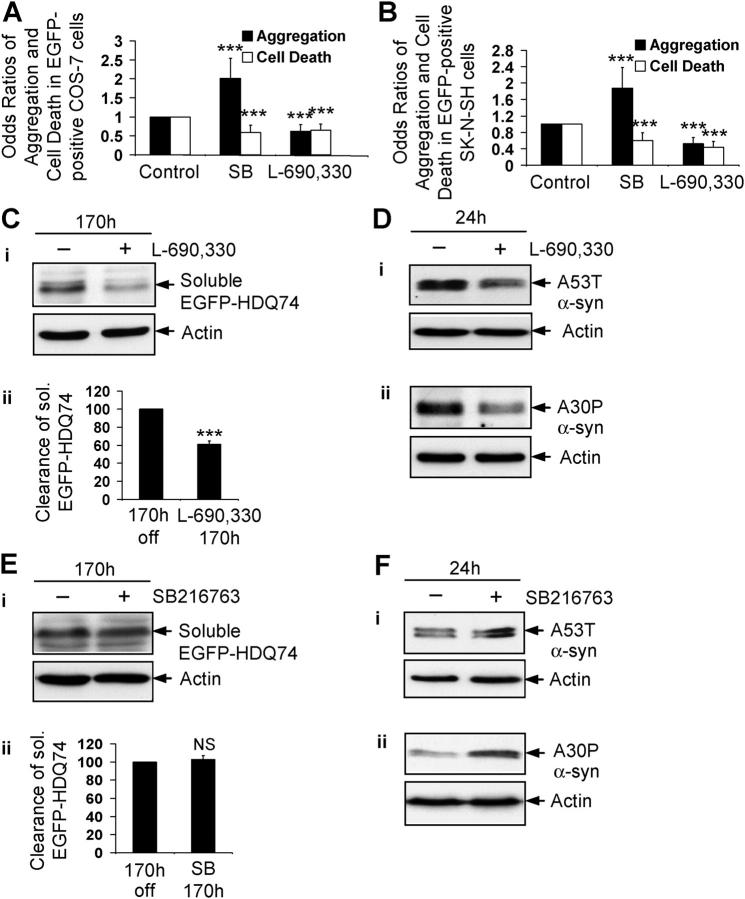
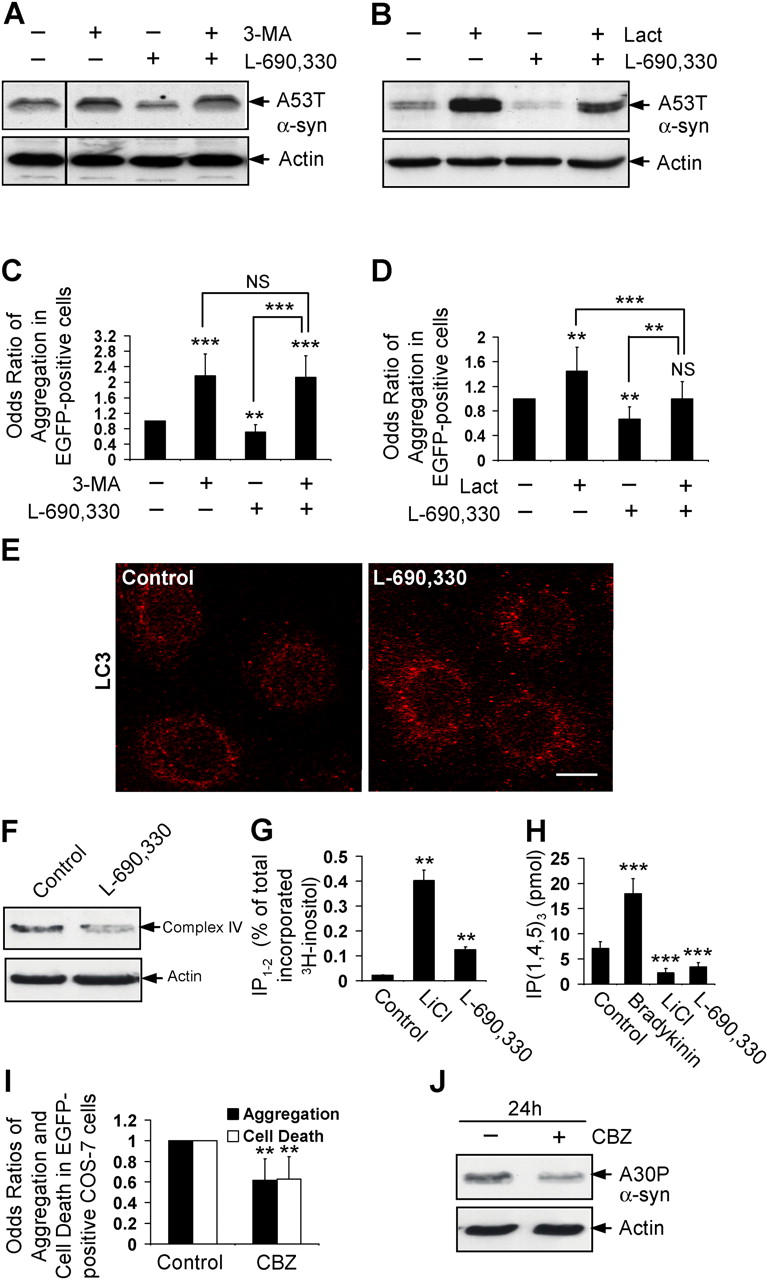
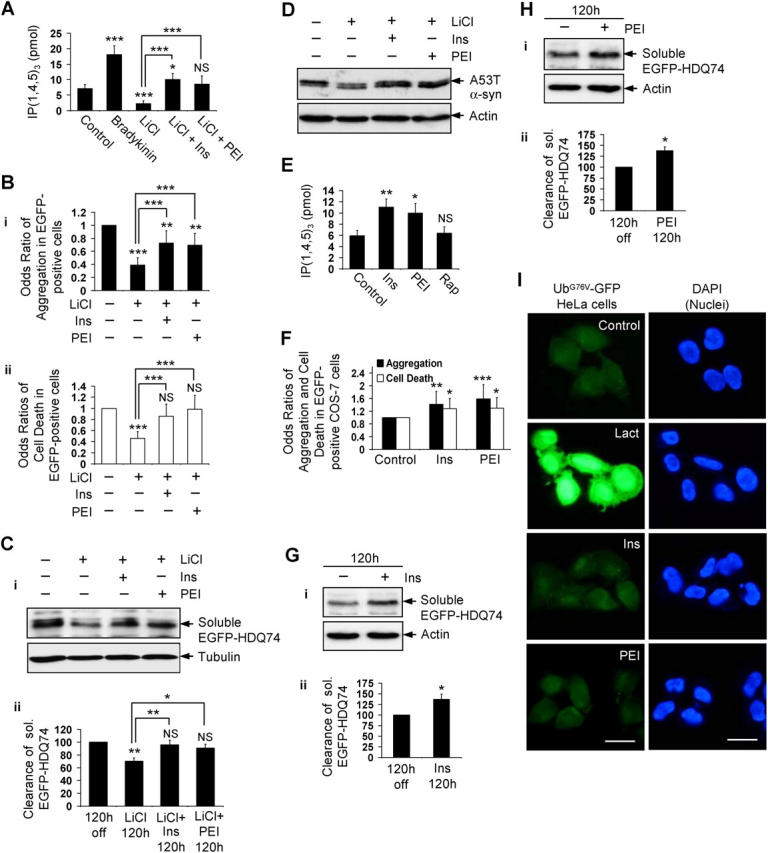
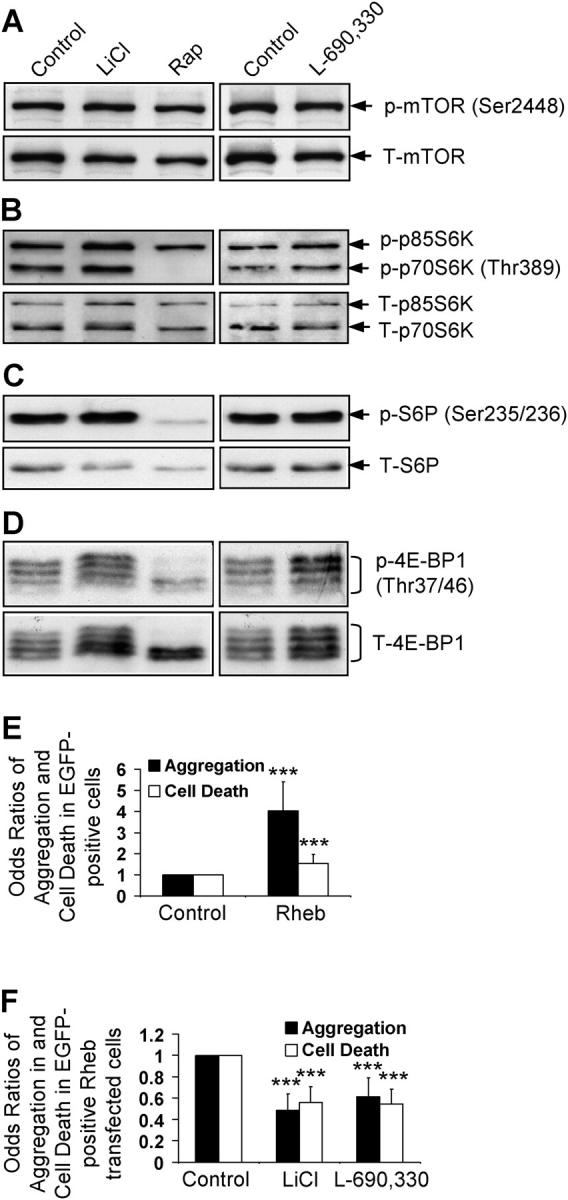
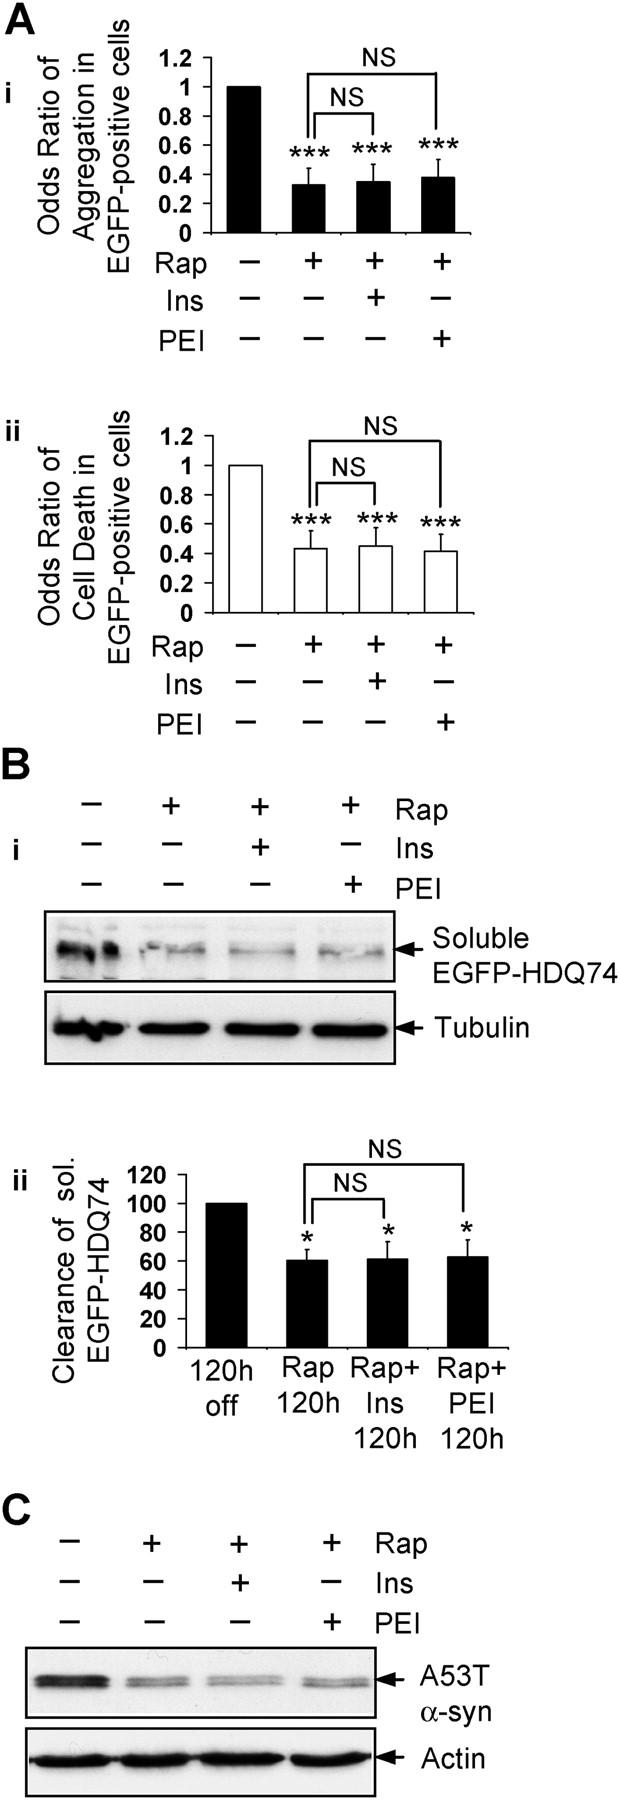
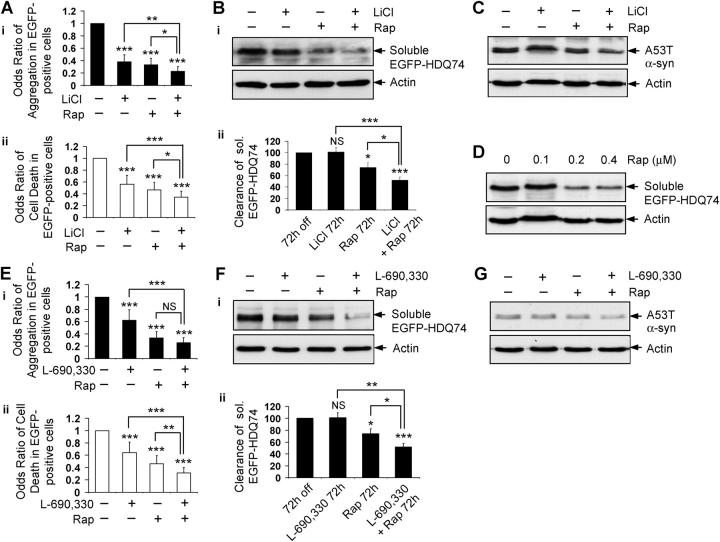
Macroautophagy is a key pathway for the clearance of aggregate-prone cytosolic proteins. Currently, the only suitable pharmacologic strategy for up-regulating autophagy in mammalian cells is to use rapamycin, which inhibits the mammalian target of rapamycin (mTOR), a negative regulator of autophagy. Here we describe a novel mTOR-independent pathway that regulates autophagy. We show that lithium induces autophagy, and thereby, enhances the clearance of autophagy substrates, like mutant huntingtin and alpha-synucleins. This effect is not mediated by glycogen synthase kinase 3beta inhibition. The autophagy-enhancing properties of lithium were mediated by inhibition of inositol monophosphatase and led to free inositol depletion. This, in turn, decreased myo-inositol-1,4,5-triphosphate (IP3) levels. Our data suggest that the autophagy effect is mediated at the level of (or downstream of) lowered IP3, because it was abrogated by pharmacologic treatments that increased IP3. This novel pharmacologic strategy for autophagy induction is independent of mTOR, and may help treatment of neurodegenerative diseases, like Huntington's disease, where the toxic protein is an autophagy substrate.


Figures

Figure 1.
Figure 1.
Lithium facilitates clearance of mutant huntingtin fragment. COS-7 (A) and SK-N-SH (B) cells transfected with pEGFP-HDQ74 were treated with or without 10 mM LiCl or 10 mM NaCl for 48 h. The effects of treatment on the percentage of EGFP-HDQ74-positive cells with aggregates or apoptotic morphology (cell death) were expressed as odds ratios. Stable inducible PC12 cells expressing EGFP-HDQ74 were induced with doxycycline for 8 h, then transgene expression was switched off for 120 h (by removing doxycycline), with (+) or without (−) 10 mM LiCl (C) or 10 mM NaCl (D). Clearance of soluble EGFP-HDQ74 was analyzed by immunoblotting with antibody against EGFP (i). Densitometry analysis of soluble EGFP-HDQ74 relative to actin (ii) was done from three independent experiments. Untreated cells were termed “120 h off”. (E) The percentage of EGFP-positive cells with aggregates in stable PC12 cells expressing EGFP-HDQ74, induced and treated for 120 h as in Fig. 1, C and D with 10 mM LiCl or 10 mM NaCl, were assessed and expressed as odds ratio compared with control condition (120 h off). (F) Clearance of aggregated and soluble EGFP-HDQ74 in stable PC12 cells as in Fig. 1 C, treated with (+) or without (−) 10 mM LiCl for 120 h, was analyzed by immunoblotting with antibody against EGFP. The aggregated EGFP-HDQ74 is seen in the stacking gel. ***, P < 0.001; NS, non-significant.
Figure 2.
Figure 2.
Lithium induces autophagy. Stable inducible PC12 cell lines expressing A53T (A) or A30P (B) α-synuclein mutants were induced with doxycycline for 48 h; expression of transgene was switched off for 24 h, with (+) or without (−) 10 mM LiCl. (i) Clearance of mutant α-synucleins was analyzed by immunoblotting with antibody against HA. (ii) Densitometry analysis of mutant α-synuclein relative to actin was done from three independent experiments. The untreated cells were termed “24 h off.” (C) Clearance of A53T (i) and A30P (ii) α-synuclein mutants in stable PC12 cells as in Fig. 2, A and B, treated with (+) or without (−) 10 mM NaCl for 24 h, was analyzed by immunoblotting with antibody against HA. (D) COS-7 cells treated with or without 10 mM LiCl or 0.2 μM rapamycin (Rap) for 24 h, were analyzed by immunofluorescence with antibody against LC3 using a confocal microscope. Bar, 20 μm. (E) COS-7 cells, treated as in Fig. 2 D, were analyzed by immunoblotting (i) with antibody against LC3. Densitometry analysis of LC3-II levels relative to actin (ii) was done from three independent experiments. (F) COS-7 cells were treated with or without 10 mM LiCl or 0.2 μM rapamycin (Rap) for 120 h, and mitochondrial load was assessed by immunoblotting with antibody to complex IV. (G) The percentage of EGFP-HDQ74–positive cells with aggregates in COS-7 cells treated with (+) or without (−) 10 mM 3-MA, 10 mM LiCl, or both for 48 h as in Fig. 1 A, were expressed as odds ratio. (H) Clearance of A53T α-synuclein in stable inducible PC12 cells as in Fig. 2 A, treated with (+) or without (−) 10 mM 3-MA, 10 mM LiCl, or both for 24 h, was analyzed by immunoblotting with antibody against HA. *, P < 0.05; **, P < 0.01; ***, P < 0.001; NS, non-significant.
Figure 3.
Figure 3.
Lithium accelerates clearance of mutant huntingtin fragment by inositol monophosphatase inhibition. The percentage of EGFP-HDQ74–positive cells with aggregates and cell death in COS-7 (A) and SK-N-SH (B) cells as in Fig. 1, A and B, treated with or without 10 μM SB216763 or 100 μM L-690,330 for 48 h, were expressed as odds ratios. (C) Clearance of soluble EGFP-HDQ74 in stable inducible PC12 cell lines as in Fig. 1 C, treated with (+) or without (−) 100 μM L-690,330 for 170 h, was analyzed by immunoblotting with antibody against EGFP (i) and densitometry (ii). (D) Clearance of A53T (i) and A30P (ii) α-synucleins in stable inducible PC12 cells as in Fig. 2, A and B, treated with (+) or without (−) 100 μM L-690,330 for 24 h, was analyzed by immunoblotting with antibody against HA. (E) Clearance of soluble EGFP-HDQ74 in stable inducible PC12 cell lines as in Fig. 1 C, treated with (+) or without (−) 10 μM SB216763 for 170 h, was analyzed by immunoblotting with antibody against EGFP (i) and densitometry (ii). (F) Clearance of A53T (i) and A30P (ii) α-synucleins in stable inducible PC12 cells as in Fig. 2, A and B, treated with (+) or without (−) 10 μM SB216763 for 24 h, was analyzed by immunoblotting with antibody against HA. ***, P < 0.001; NS, non-significant.
Figure 4.
Figure 4.
Lithium induces autophagy by inositol monophosphatase inhibition. Clearance of A53T α-synuclein in stable inducible PC12 cells as in Fig. 2 A, treated with (+) or without (−) 10 mM 3-MA, 100 μM L-690,330, or both (A), or 10 μM lactacystin (Lact), 100 μM L-690,330, or both (B) for 24 h, was analyzed by immunoblotting with antibody against HA. The percentage of EGFP-HDQ74–positive cells with aggregates in COS-7 cells as in Fig. 1 A, treated with (+) or without (−) 10 mM 3-MA, 100 μM L-690,330, or both (C), or 10 μM lactacystin (Lact), 100 μM L-690,330, or both (D) for 48 h, were expressed as odds ratio. (E) COS-7 cells treated with (+) or without (−) 100 μM L-690,330 for 24 h were analyzed by immunofluorescence with antibody against LC3 using a confocal microscope. Bar, 20 μm. (F) COS-7 cells were treated with or without 100 μM L-690,330 for 170 h, and mitochondrial load was assessed by immunoblotting with antibody to complex IV. (G) Levels of IP1-2 were measured in COS-7 cells treated with 10 mM LiCl or 100 μM L-690,330 for 24 h. (H) Levels of IP3 were measured in COS-7 cells treated with 2 μM bradykinin, 10 mM LiCl, or 100 μM L-690,330 for 5 min. (I) The percentage of EGFP-HDQ74–positive cells with aggregates and cell death in COS-7 cells as in Fig. 1 A, treated with or without 50 μM CBZ for 48 h, were expressed as odds ratios. (J) Clearance of A30P α-synuclein in stable inducible PC12 cells as in Fig. 2 B, treated with (+) or without (−) 50 μM CBZ for 24 h, was analyzed by immunoblotting with antibody against HA. **, P < 0.01; ***, P < 0.001; NS, non-significant.
Figure 5.
Figure 5.
Lithium accelerates clearance of mutant huntingtin fragment by reducing free inositol and IP 3 levels. (A) IP3 levels were measured in COS-7 cells treated for 5 min with or without 2 μM bradykinin, 10 mM LiCl, or 10 mM LiCl pretreated for 5 min with 1 mM myo-inositol (Ins) or 24 μM prolyl endopeptidase inhibitor 2 (PEI). (B) The percentage of EGFP-HDQ74–positive cells with aggregates (i) and cell death (ii) in COS-7 cells as in Fig. 1 A, either left untreated or treated with 10 mM LiCl with (+) or without (−) 1mM myo-inositol or 24 μM PEI for 48 h, were expressed as odds ratios. (C) Clearance of soluble EGFP-HDQ74 in stable PC12 cells as in Fig. 1 C, either left untreated or treated with 10 mM LiCl with (+) or without (−) 1 mM myo-inositol or 24 μM PEI for 120 h, was analyzed by immunoblotting with antibody against EGFP (i) and densitometry (ii). (D) Clearance of A53T α-synuclein in stable PC12 cells as in Fig. 2 A, either left untreated or treated with 10 mM LiCl with (+) or without (−) 1 mM myo-inositol or 24 μM PEI for 24 h, was analyzed by immunoblotting with antibody against HA. (E) IP3 levels were measured in COS-7 cells treated with or without 1 mM myo-inositol, 24 μM PEI or 0.2 μM rapamycin (Rap) for 5 min. (F) The percentage of EGFP-HDQ74–positive cells with aggregates and cell death in COS-7 cells as in Fig. 1 A, treated with or without 1 mM myo-inositol or 24 μM PEI for 48 h, were expressed as odds ratios. Clearance of soluble EGFP-HDQ74 in stable PC12 cells as in Fig. 1 C, treated with (+) or without (−) 1 mM myo-inositol (G) or 24 μM PEI (H) for 120 h, was analyzed by immunoblotting with antibody against EGFP (i) and densitometry (ii). (I) HeLa cells expressing UbG76V-GFP reporter, treated with or without 10 μM lactacystin (Lact), 1 mM myo-inositol, or 24 μM PEI for 24 h, were analyzed by fluorescence microscopy. Bar, 20 μm. *, P < 0.05; **, P < 0.01; ***, P < 0.001; NS, non-significant; Ins, myo-inositol.
Figure 6.
Figure 6.
Lithium and IMPase inhibitor do not impair mTOR signaling. COS-7 cells treated with or without 10 mM LiCl, 0.2 μM rapamycin (Rap), or 100 μM L-690,330 for 24 h, were analyzed for mTOR activity by immunoblotting for levels of phospho and total mTOR (A), ribosomal S6 protein kinase (B), S6P (C), and 4E-BP1 (D). (E and F) COS-7 cells transfected with pEGFP-HDQ74 along with empty vector (pCDNA3.1) or pRheb at 1:3 ratio (E). The rheb-transfected cells were treated with or without 10 mM LiCl or 100 μM L-690,330; the control represents untreated rheb-transfected cells (F). The proportion of GFP-positive cells with aggregates or cell death were assessed after 48 h and expressed as odds ratios. ***, P < 0.001.
Figure 7.
Figure 7.
The ability of rapamycin to enhance clearance of mutant huntingtin and α-synuclein is not impaired by increasing intracellular IP 3 . (A) The percentage of EGFP-HDQ74-positive cells with aggregates (i) and cell death (ii) in COS-7 cells as in Fig. 1 A, either left untreated or treated with 0.2 μM rapamycin with (+) or without (−) 1 mM myo-inositol (Ins) or 24 μM PEI for 48 h, were expressed as odds ratios. (B) Clearance of soluble EGFP-HDQ74 in stable PC12 cells as in Fig. 1 C, either left untreated or treated with 0.2 μM rapamycin with (+) or without (−) 1 mM myo-inositol or 24 μM PEI for 120 h, was analyzed by immunoblotting with antibody against EGFP (i) and densitometry (ii). (C) Clearance of A53T α-synuclein in stable PC12 cells as in Fig. 2 A, either left untreated or treated with 0.2 μM rapamycin (Rap) with (+) or without (−) 1 mM myo-inositol or 24 μM PEI for 24 h, was analyzed by immunoblotting with antibody against HA. *, P < 0.05; ***, P < 0.001; NS, non-significant; Ins, myo-inositol.
Figure 8.
Figure 8.
Induction of autophagy by two independent pathways has an additive effect on the clearance of mutant proteins. (A) The percentage of EGFP-HDQ74–positive cells with aggregates (i) and cell death (ii) in COS-7 cells as in Fig. 1 A, treated with (+) or without (−) 10 mM LiCl, 0.2 μM rapamycin (Rap), or both for 48 h, were expressed as odds ratios. (B) Clearance of soluble EGFP-HDQ74 in stable PC12 cells as in Fig. 1 C, treated with (+) or without (−) 10 mM LiCl, 0.2 μM rapamycin (Rap), or both for 72 h, was analyzed by immunoblotting with antibody against EGFP (i) and densitometry (ii). (C) Clearance of A53T α-synuclein in stable PC12 cells as in Fig. 2 A, treated with (+) or without (−) 10 mM LiCl, 0.2 μM rapamycin (Rap), or both for 8 h, was analyzed by immunoblotting with antibody against HA. (D) Clearance of soluble EGFP-HDQ74 in stable PC12 cells as in Fig. 1 C, treated with (+) or without (−) 0.1, 0.2, or 0.4 μM rapamycin (Rap) for 72 h, was analyzed by immunoblotting with antibody against EGFP. (E) The percentage of EGFP-HDQ74–positive cells with aggregates (i) and cell death (ii) in COS-7 cells as in Fig. 1 A, treated with (+) or without (−) 100 μM L-690,330, 0.2 μM rapamycin (Rap), or both for 48 h, were expressed as odds ratios. (F) Clearance of soluble EGFP-HDQ74 in stable PC12 cells as in Fig. 1 C, treated with (+) or without (−) 100 μM L-690,330, 0.2 μM rapamycin (Rap), or both for 72 h, was analyzed by immunoblotting with antibody against EGFP (i) and densitometry (ii). (G) Clearance of A53T α-synuclein in stable PC12 cells as in Fig. 2 A, treated with (+) or without (−) 100 μM L-690,330, 0.2 μM rapamycin (Rap), or both for 8 h, was analyzed by immunoblotting with antibody against HA. *, P < 0.05; **, P < 0.01; ***, P < 0.001; NS, non-significant.

References

    1. Atack, J.R., S.M. Cook, A.P. Watt, S.R. Fletcher, and C.I. Ragan. 1993. In vitro and in vivo inhibition of inositol monophosphatase by the bisphosphonate L-690,330. J. Neurochem. 60:652–658. - PubMed
    1. Berridge, M.J., C.P. Downes, and M.R. Hanley. 1989. Neural and developmental actions of lithium: a unifying hypothesis. Cell. 59:411–419. - PubMed
    1. Camus, M., G. Hennere, G. Baron, G. Peytavin, L. Massias, F. Mentre, and R. Farinotti. 2003. Comparison of lithium concentrations in red blood cells and plasma in samples collected for TDM, acute toxicity, or acute-on-chronic toxicity. Eur. J. Clin. Pharmacol. 59:583–587. - PubMed
    1. Carmichael, J., K.L. Sugars, Y.P. Bao, and D.C. Rubinsztein. 2002. Glycogen synthase kinase-3β inhibitors prevent cellular polyglutamine toxicity caused by the Huntington's disease mutation. J. Biol. Chem. 277:33791–33798. - PubMed
    1. Coghlan, M.P., A.A. Culbert, D.A. Cross, S.L. Corcoran, J.W. Yates, N.J. Pearce, O.L. Rausch, G.J. Murphy, P.S. Carter, L. Roxbee Cox, et al. 2000. Selective small molecule inhibitors of glycogen synthase kinase-3 modulate glycogen metabolism and gene transcription. Chem. Biol. 7:793–803. - PubMed

Publication types

MeSH terms