Comparative Study
. 2005 Oct 4;102(40):14458-62.
doi: 10.1073/pnas.0503955102. Epub 2005 Sep 26.

Hierarchical metabolomics demonstrates substantial compositional similarity between genetically modified and conventional potato crops

Affiliations
Comparative Study

Hierarchical metabolomics demonstrates substantial compositional similarity between genetically modified and conventional potato crops

Gareth S Catchpole et al. Proc Natl Acad Sci U S A. .

Abstract

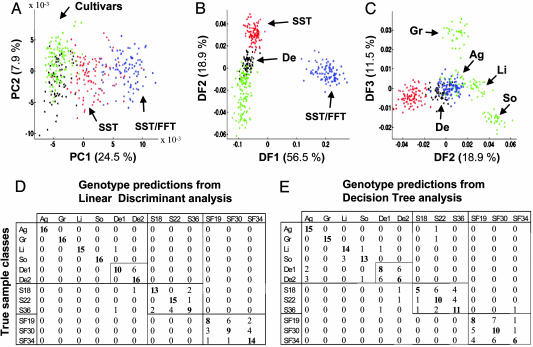
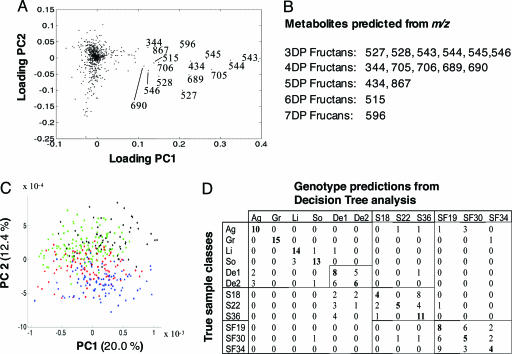
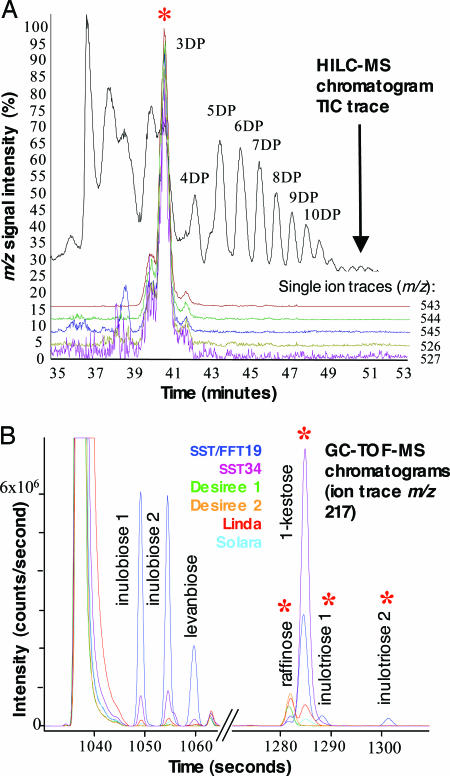
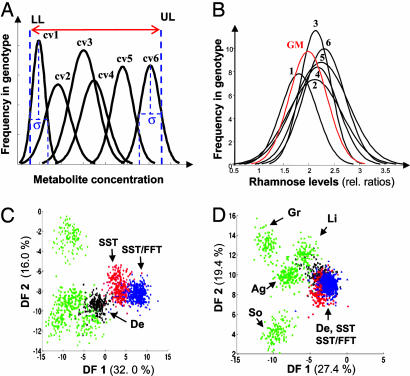
There is current debate whether genetically modified (GM) plants might contain unexpected, potentially undesirable changes in overall metabolite composition. However, appropriate analytical technology and acceptable metrics of compositional similarity require development. We describe a comprehensive comparison of total metabolites in field-grown GM and conventional potato tubers using a hierarchical approach initiating with rapid metabolome "fingerprinting" to guide more detailed profiling of metabolites where significant differences are suspected. Central to this strategy are data analysis procedures able to generate validated, reproducible metrics of comparison from complex metabolome data. We show that, apart from targeted changes, these GM potatoes in this study appear substantially equivalent to traditional cultivars.


Figures

Fig. 1.
Fig. 1.
FIE-MS (+) metabolite fingerprints of tuber extracts from five conventional potato cultivars [Ag, Agria; De, Désirée (1 and 2); Gr, Granola; Li, Linda; So, Solara] and two types of transgenic lines (SST and SST/FFT) analyzed by different multivariate data analysis methods. (A) PCA with Désirée genotypes are colored black, other cultivars are colored green, SST genotypes are colored red, and SST-FFT genotypes are colored blue. The PCA scores plots for PC1 versus PC2 are presented. (B and C) LDA with color coding as in A. The LDA scores plots for DF1 versus DF2 (B) and DF2 versus DF3 (C) are presented. (D and E) Confusion matrix of the LDA class predictions and decision tree class predictions in the test set. The confusion matrices are read in rows, with the numbers indicating the frequency with which samples are predicted to be either of the true class or an alternative genotype. Correct classifications are highlighted in bold.
Fig. 2.
Fig. 2.
Identification of top-ranking ions for genotype separation in PCA and effect on multivariate models when omitted from data. From a PCA, it is possible to investigate the contribution of each variable to each of the principal components, a metric referred to as the loadings score. (A) Loadings plot of PC1 versus PC2 of FIE-MS fingerprint data representing GM and non-GM potatoes used to derive Fig. 1 A. (B) The m/z of 15 ions with high-loading scores (>0.1) in the PC1 dimension are labeled, and all were found to be masses typical of fructans with varying DP (Table 2). (C) PCA using FIE-MS data with top-ranked ions (>0.05 in PC1) omitted. (D) Decision tree analysis using FIE-MS data with top-ranked ions (>0.05 in PC1) omitted.
Fig. 3.
Fig. 3.
Identification of discriminatory metabolites in GM potato tubers by LC-MS and GC-MS. (A) Overlaid single-ion chromatograms of top-ranked variables predicted to represent ions derived from a fructan with 3 DP in an example SF30 extract analyzed by hydrophilic interaction LC-MS. The major peak with coincident signals from extracted ion chromatograms of m/z 543, 544, 545, 526, and 527 at the retention time of 3-DP fructans in the total ion current (TIC) trace is indicated with a red asterisk. The position of peaks representing fructans of increasing DP are indicated. (B) Exemplary GC-TOF-extracted ion chromatogram m/z 217 for GM and non-GM potato tubers, enlarged for discriminatory disaccharide and trisaccharide regions. Separation of the discriminatory peaks of inulobiose 1, inulobiose 2, and levanbiose from the major disaccharide sucrose and separation of the discriminatory trisaccharide peaks of inulotriose 1 and inulotriose 2 from 1-kestose and raffinose (red asterisk) are indicated. The increase in discriminatory abundances of 2- and 3-DP fructans in GM lines and the presence of 1-kestose in Linda and Solara cultivars is shown, whereas 1-kestose is absent in the direct GM comparator Désirée.
Fig. 4.
Fig. 4.
GC-TOF profiling to detect and assess the impact of out-of-range metabolites in comparison to GM genotypes with conventional potato cultivars. (A) Visualization of the concept of metabolite concentration out-of-range assessment in substantial equivalence analysis. Determination of frequency distributions of metabolites in six cultivars (cv) regarded as a safe result in an upper limit (UL) and lower limit (LL) of concentration for each commonly detected metabolite. (B) Illustration of the out-of-range assessment concept using rhamnose levels (relative ratio of metabolite peak area in data normalized to total peak area in each chromatogram). Frequency distributions of ≈150 tubers per potato line have been curve-fitted. 1, Linda; 2, Désirée1; 3, Désirée2; 4, Solara; 5, Granola; 6, Agria; GM, single transformant of line S22. Average rhamnose levels in S22 are found significantly different from the Désirée parental lines in univariate statistics but fall well within the overall range typical of potato cultivars. (C) LDA scores plot of GC-TOF data. (D) Scores plot of LDA performed on the same data but with the omission of the six discriminatory fructan peaks representing levanbiose, 1-kestose, inulobiose, and inulotriose (see Fig. 3B).

Similar articles

Cited by

References

    1. Organisation for Economic Cooperation and Development (2001) Report of the OECD Workshop on the Nutritional Assessment of Novel Foods and Feeds (Org. Econ. Cooperation Dev., Ottawa).
    1. Kok, E. J. & Kuiper, H. A. (2003) Trends in Biotechnol. 21, 439-444. - PubMed
    1. Hellwege, E. M., Czapla, S., Jahnke, A., Willmitzer, L. & Heyer, A. G. (2000) Proc. Natl. Acad. Sci. USA 97, 8699-8704. - PMC - PubMed
    1. Edelman, J. & Jefford, T. G. (1968) New Phytol. 67, 517-531.
    1. Gibson, G. R., Beatty, E. R., Wang, X. & Cummings, J. H. (1995) Gastroenterology 108, 968-975. - PubMed

Publication types

MeSH terms

LinkOut - more resources